Help us direct you to the right place to sign up

One of the most important data points when considering investing in real estate is a cap rate. Cap rates help investors decide whether a building is a good investment or not, and comparing cap rates to competitive buildings can help to determine how a property is performing compared to the market. So what exactly is a cap rate? How can we calculate it? And why do some buildings have extremely low or high cap rates?
What is a Cap Rate?
A building’s cap rate quantifies the relationship between a building’s price and the income it brings in. Formally, cap rate is defined as the Net Operating Income divided by Asset Price. Net operating income is the net amount of building income left over after accounting for all expenses including building maintenance, salaries, and utilities. The asset price is simply the price at which the building was last sold. The higher the cap rate, the faster a building will deliver a return on invested capital. A building with a cap rate of 20% will return all initial capital to the investor within 5 years, conversely, a building with a 10% cap rate will take 10 years to return invested capital to the investor.
Why Do Cap Rates Change?
In short, cap rates reflect the inherent stability or risk of an asset. Buildings in well-established markets that aren’t going anywhere, like Manhattan or San Francisco, generally sell for some of the lowest cap rates. At CompStak, you can discover CRE trends including cap rates data, for example, office buildings in midtown Manhattan are generally capitalized with a cap rate of 4,5%. Conversely, assets in riskier markets generally attract much higher cap rates as there is substantial uncertainty about the future of the market – demand for rental space, employment opportunities, and other economic factors. Oftentimes, lowering cap rates can be a bellwether of emerging markets or specific property types — for example, increased demand for industrial spaces accelerated by COVID-19 drove industrial cap rates, indicating unprecedented investor demand for the asset class.
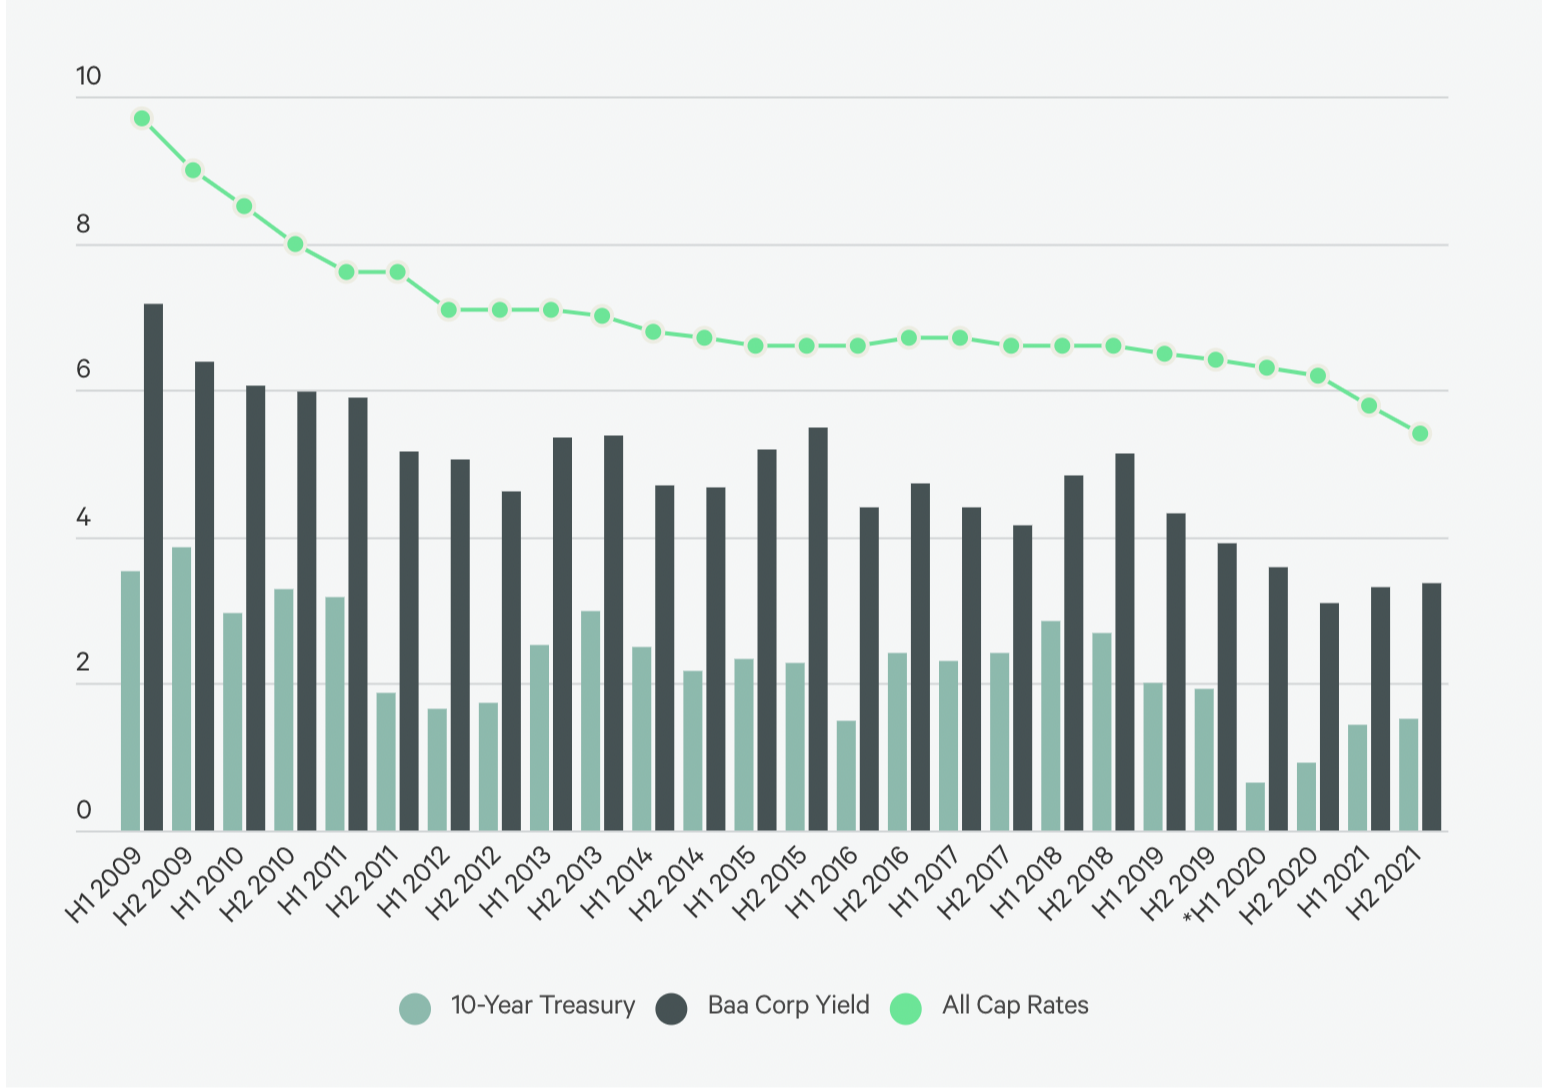
Real Estate Cap Rate and Bond Yeld (%). Source: CBRE, U.S Cap Rate Survey H2 2021
When deciding whether an investment is a good idea, investors will often compare the cap rate and investment offers with the prevailing market average of comparable properties. What is a property’s rent roll? Is it below market and can be increased? Would the landlord struggle to fill in space if an anchor tenant left? Investors forecast market dynamics such as lease termination and renewal and use industry-standard valuation and accounting techniques to fairly assess a building’s value. To see this in action and understand why extreme cap rates can occur let’s consider one of the strangest CRE deals of recent years.

Unique Cap Rates Examples
What comes to mind when you think of Zanesville, Ohio? Corn? High school football? Americana? The Muskingum River? Well for a long time one of the most memorable aspects of Zanesville was wicker baskets. Zanesville was home to the Longaberger Basket Company, which manufactured wicker baskets for the broader US market. The company wanted to be better known, and to do so, they built their Zanesville headquarters in the shape of a giant, office building-sized basket, complete with enormous, never used handles. The business was not built to last, and in 2018 the company went bankrupt and they put its office on the auction block.
Longaberger’s office represents a perfect example of the sort of building liable to fetch a very high cap rate. Landlords want certainty that they can successfully retain tenants — the entirety of Longaberger’s office was occupied by Longaberger itself, and thus set to become vacant once the company shut down. When landlords take on a vacant building, they look to see whether there is demand for their assets in the market. Zanesville is a relatively small city with a tiny office space market. Those who were in the market were more likely to consider Longaberger’s quirks a downside rather than charm. A potential investor could choose to remodel Longaberger’s building to make it more office-like, but this would take substantial costs. In short, Longaberger was in a pickle, and the property was sold for an astonishing $1.2 million to be remodeled and turned into a hotel. However, due to COVID-19 the initial plan for the building renovation has changed.
Want to be able to evaluate investment opportunities like the Longaberger “Basket Building” in detail? Utilize CompStak’s market-leading database and analytics suite to delve deep into leasing data such as tenant concessions, lease start dates, and net effective rents to make decisions with confidence.
Related Posts
Key Metrics for Commercial Real Estate Underwriting


