Help us direct you to the right place to sign up

SKIP AHEAD TO
CompStak aggregates commercial property transactions from our pre-qualified network of over 35,000 commercial brokers, appraisers, and researchers to create the most granular property and lease database in the industry. With this data foundation, we’ve developed a sophisticated suite of analytics tools to help you discover current trends and make data-informed business decisions.
Not a client yet?
What is CompStak Analytics?
CompStak’s robust Analytics Suite is a set of tools that allow users to evaluate relevant current and historical leasing metrics:
– Market Dashboard – A market-based research and productivity tool that enables users to review and share key activity, insights, and trends.
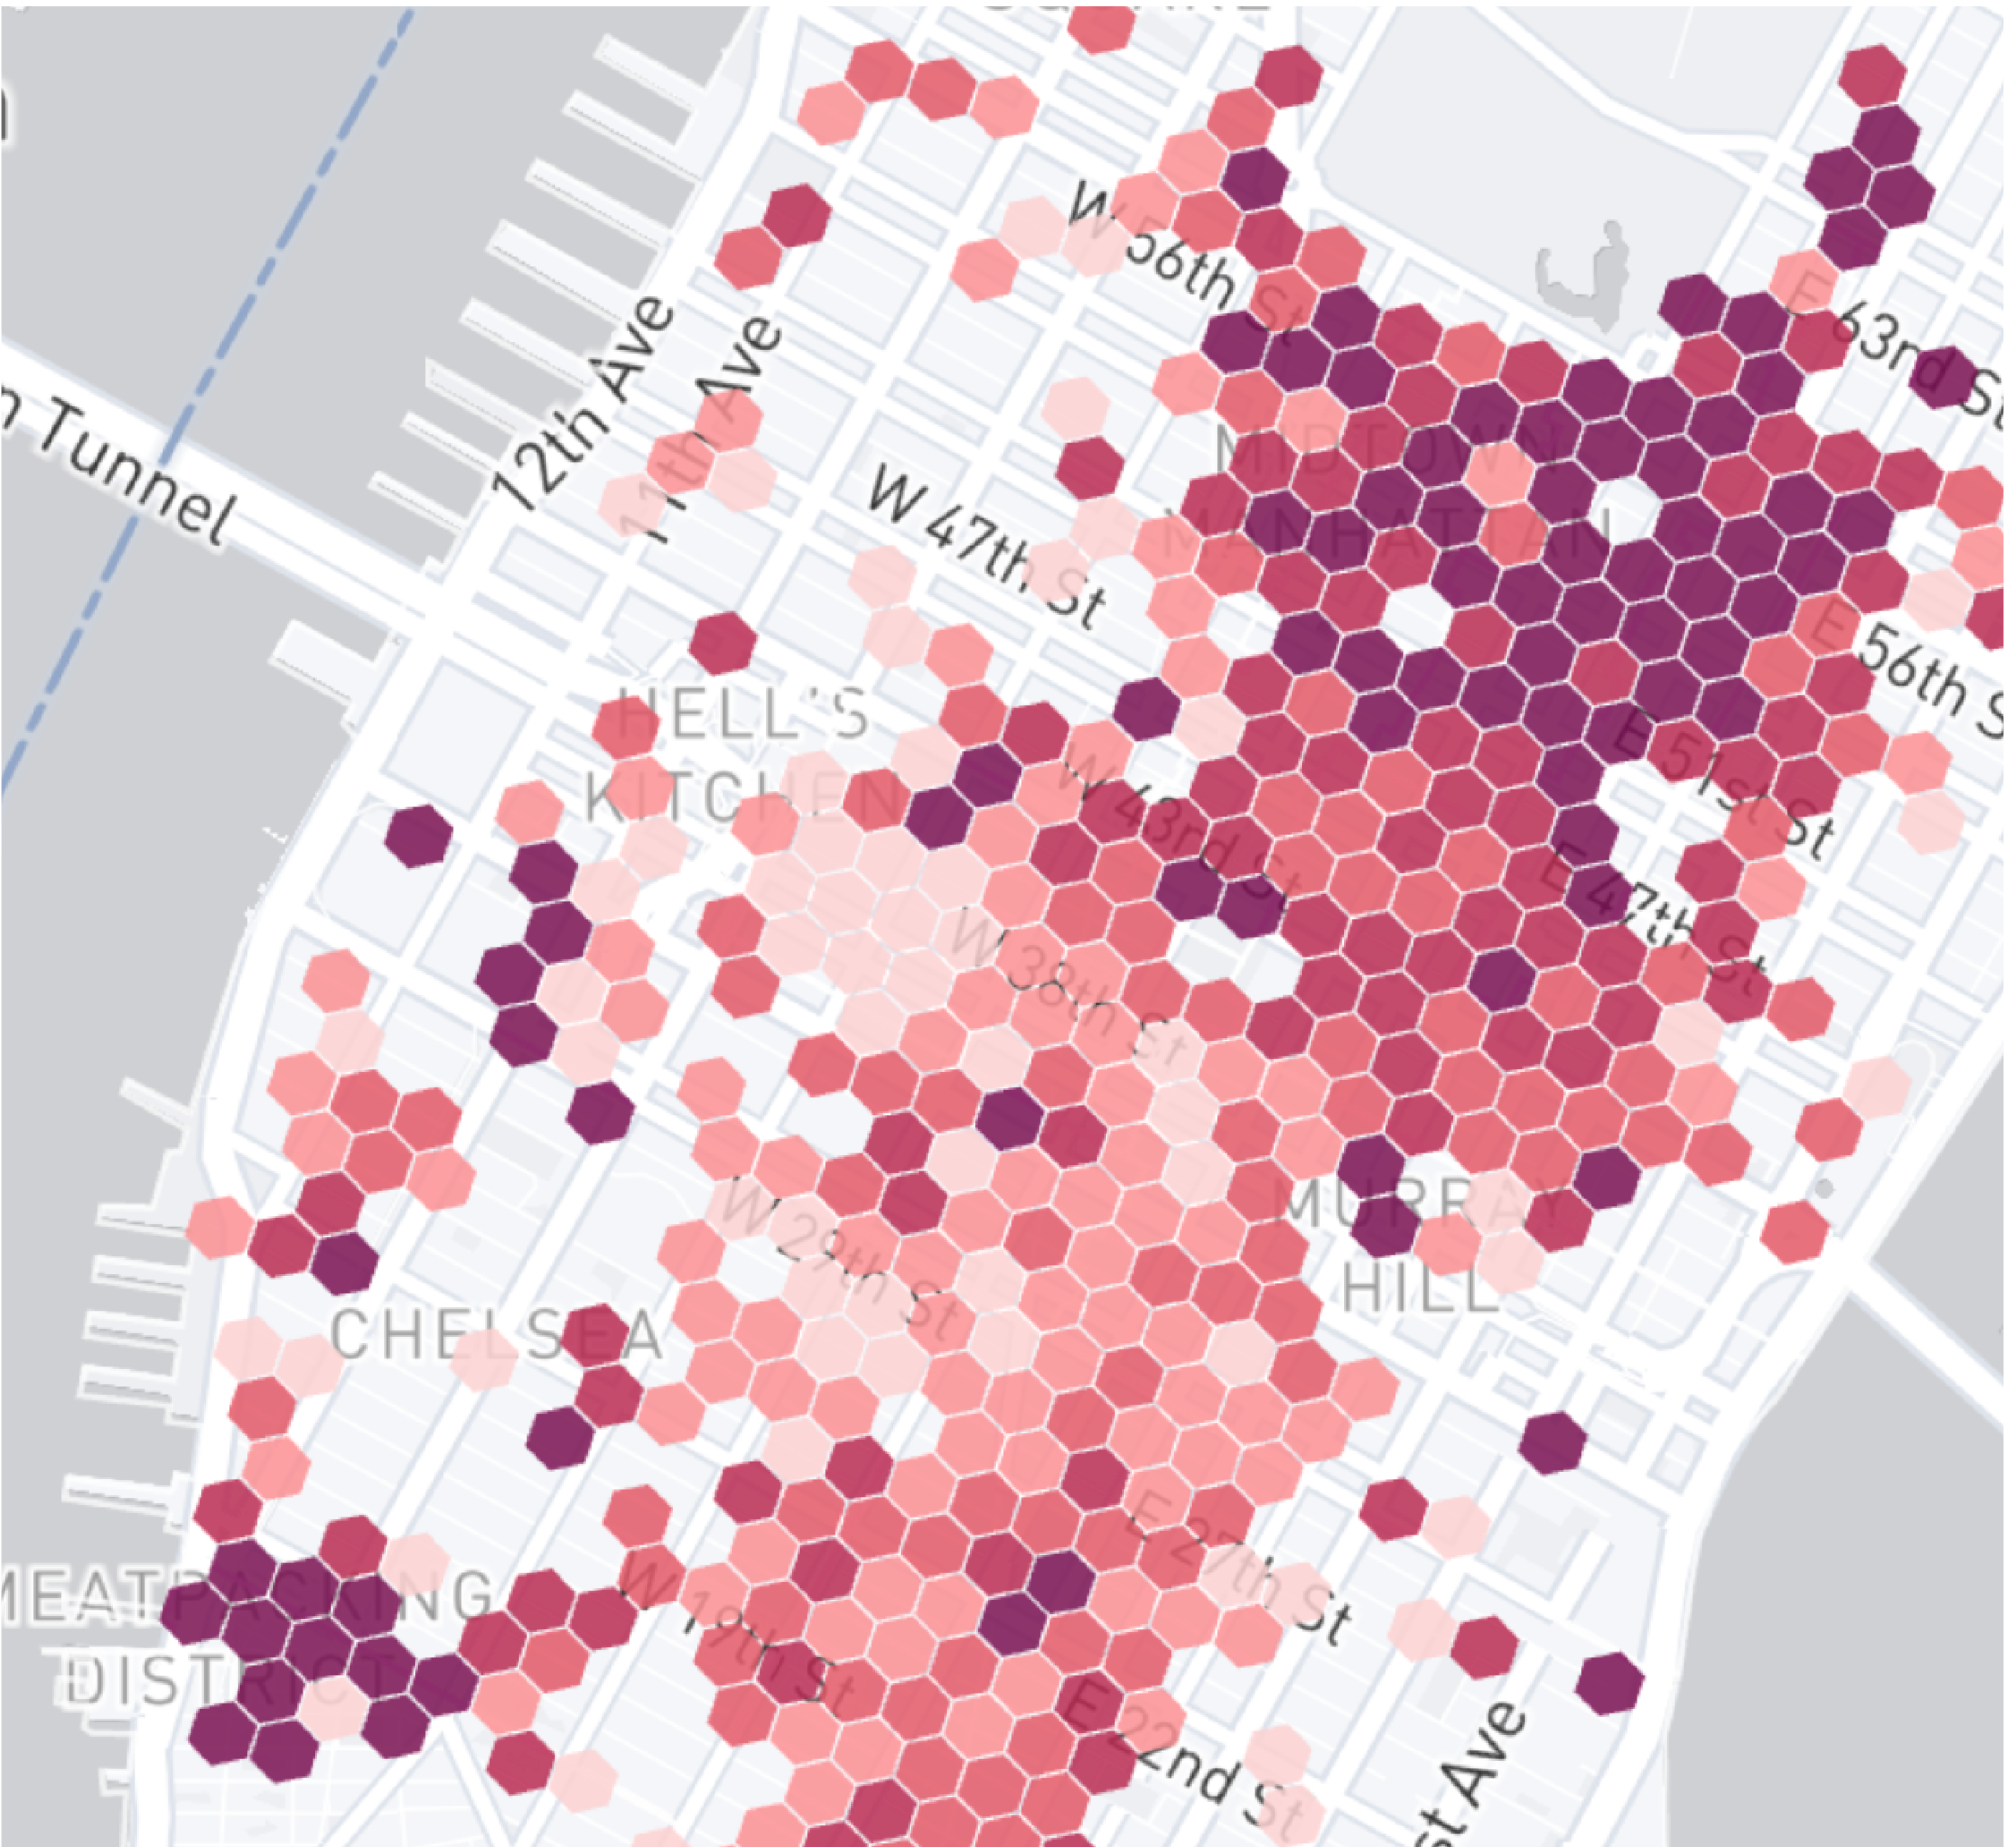
– Map Analytics – Generate map based market insights, customize data visualizations including heat maps, time lapse applicable to market rent, lease expiration, and other data.
– Chart Builder – Your go-to feature for an in-depth analysis of specific data sets. Uncover trends utilizing CompStak’s granular data filters or pull in your previously saved searches.
With CompStak Analytics’ extensive database, you can review starting and effective rent growth rates, understand concession trends, examine lease terms, and customize heat maps and charts using extensive filters.

Why CompStak Analytics?
Making data-informed commercial real estate decisions is critical. Decision makers need to have a firm understanding of the market conditions and trends. Decision makers need the capacity to compare properties of interest on a granular level with comparable properties. Decision makers need to access data that is broad reaching and of high quality.
Compstak Analytics is built with these requirements in mind. Compstak’s Market Dashboard illustrates a global picture of market conditions with the real-time capacity to identify emergent trends. CompStak’s Map Analytics feature creates intuitive visualizations of the geography of commercial real estate. CompStak’s Chart Builder acts as a trusted advisor for investment decisions and property evaluation by providing a toolkit for in-depth side by side comparison of properties of interest.
Analytics Features
|
Market Rent: Explore market starting and effective rents across office and industrial markets, narrowing down results by specific submarkets and properties. |
 |
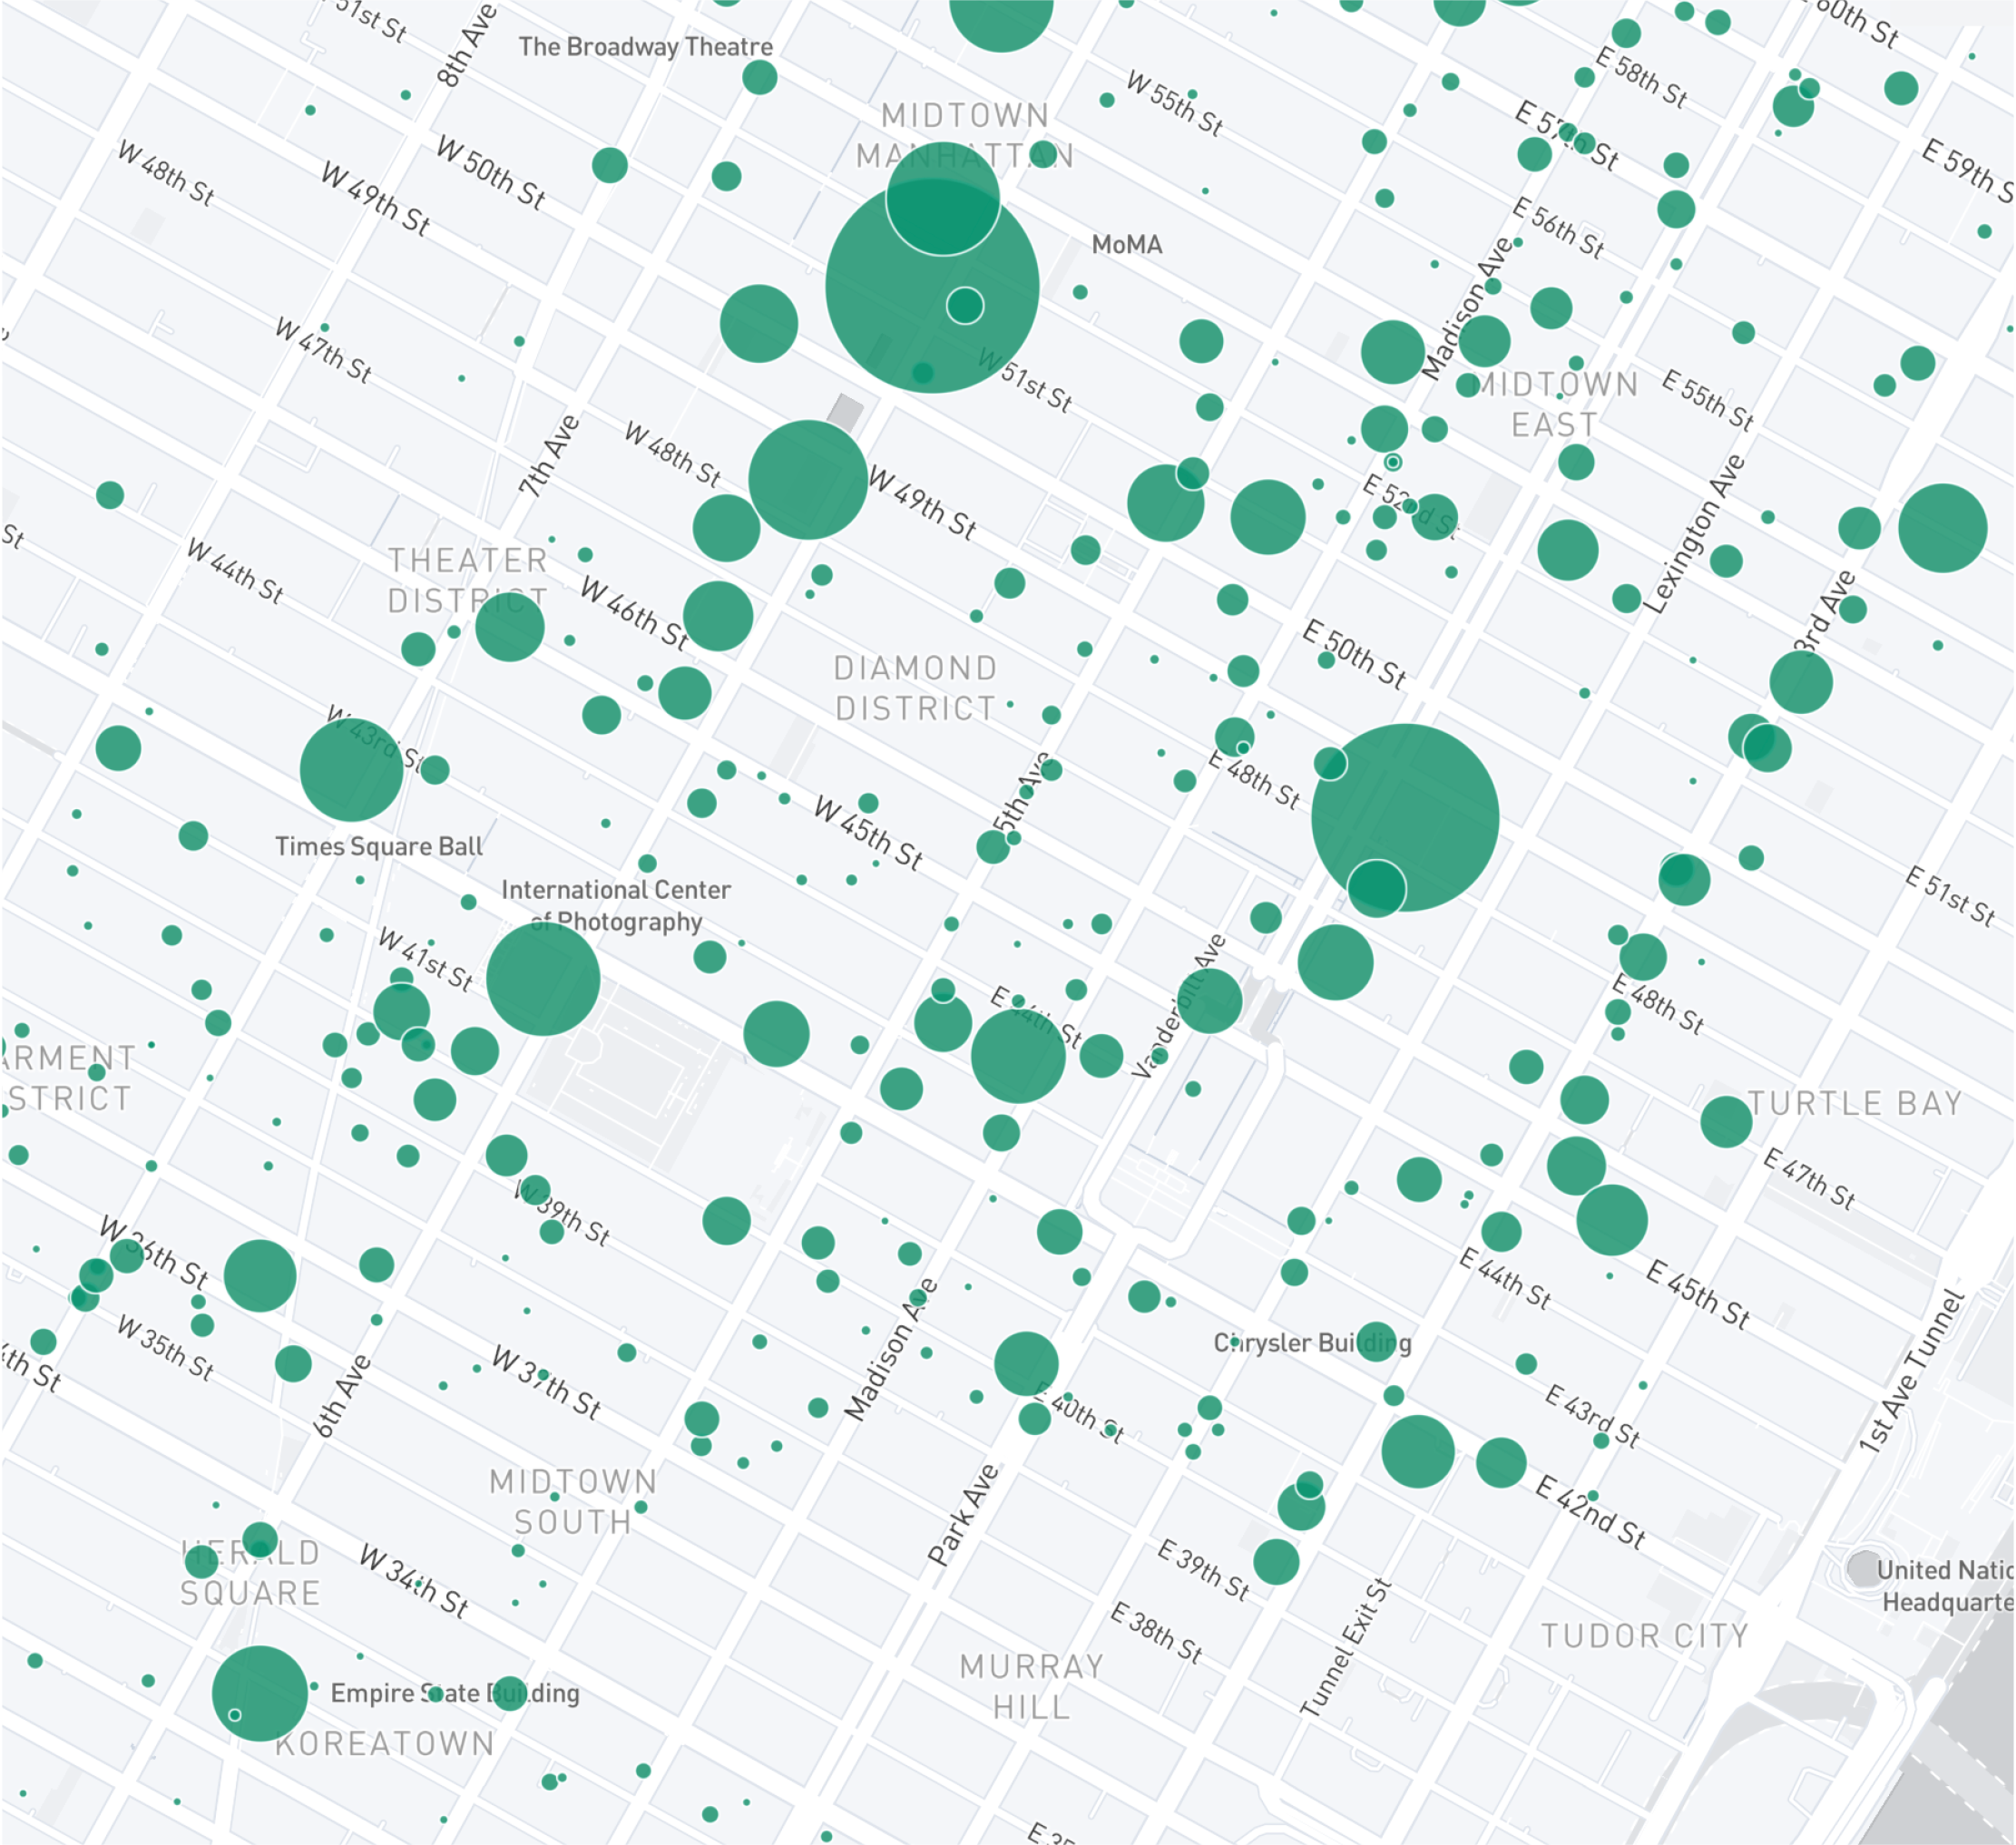 |
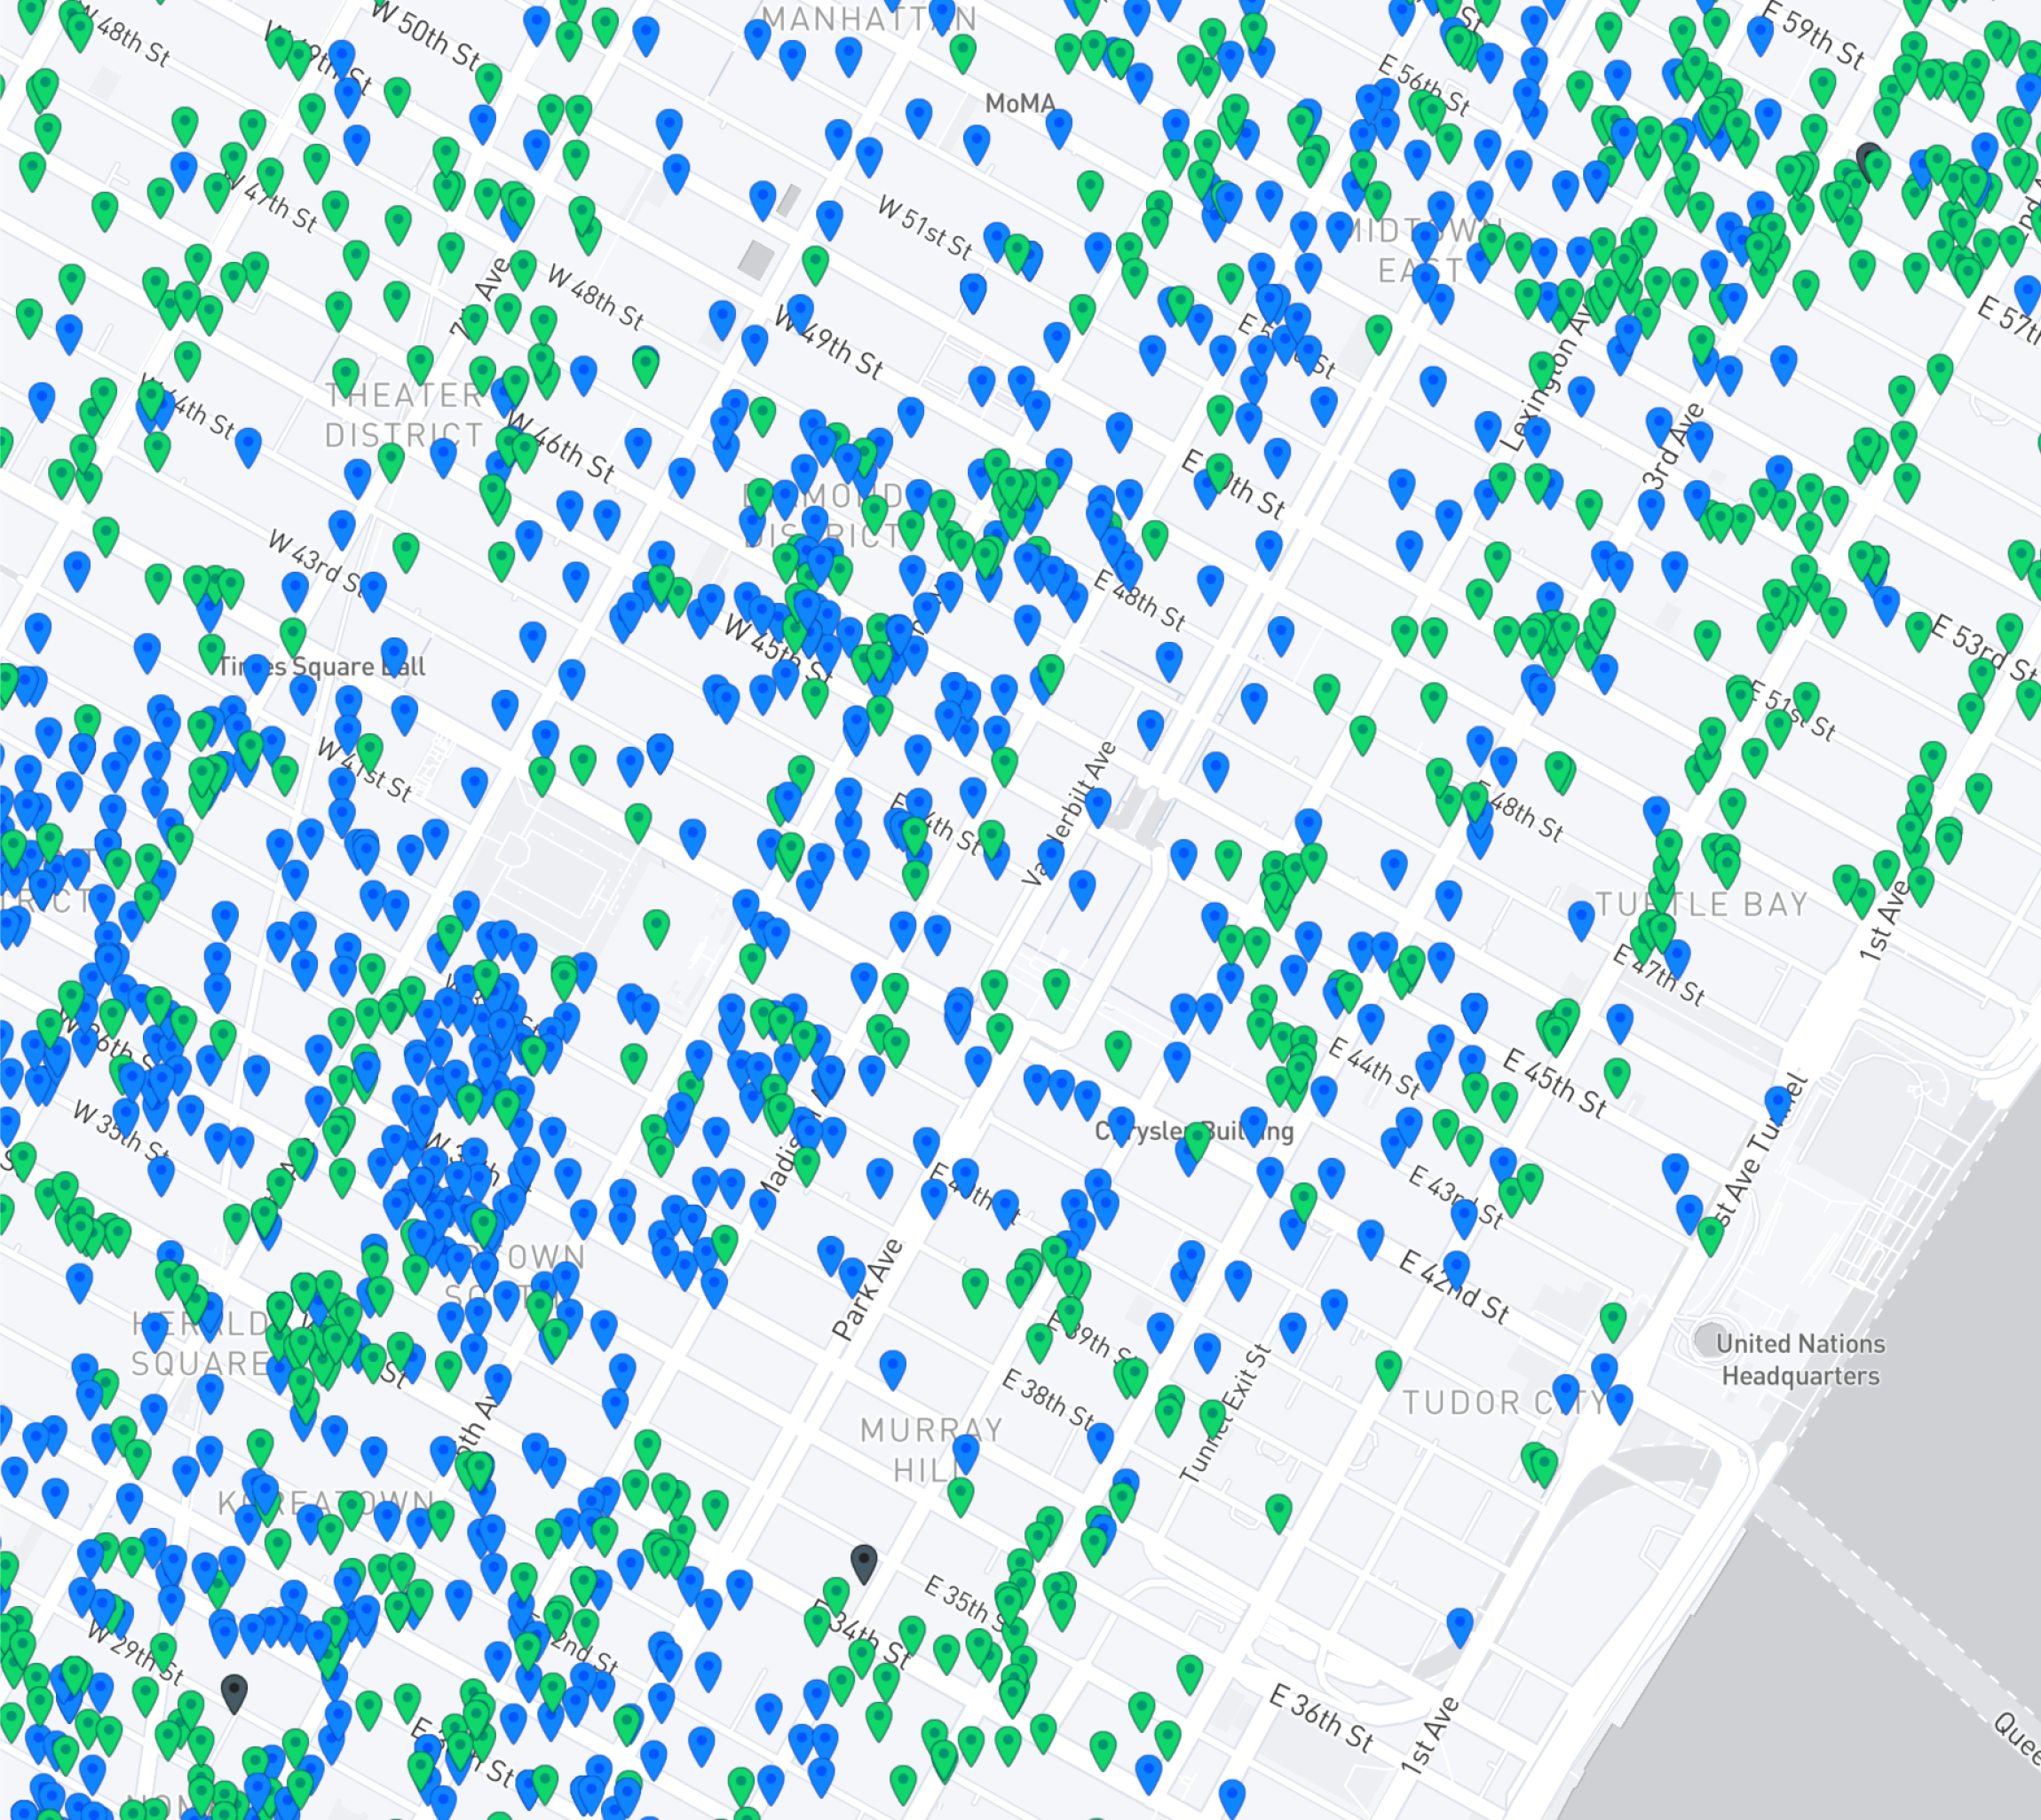
Lease Expiration: Check the density of lease expirations by market and track how lease expirations change over six-month intervals using time lapses. |
|
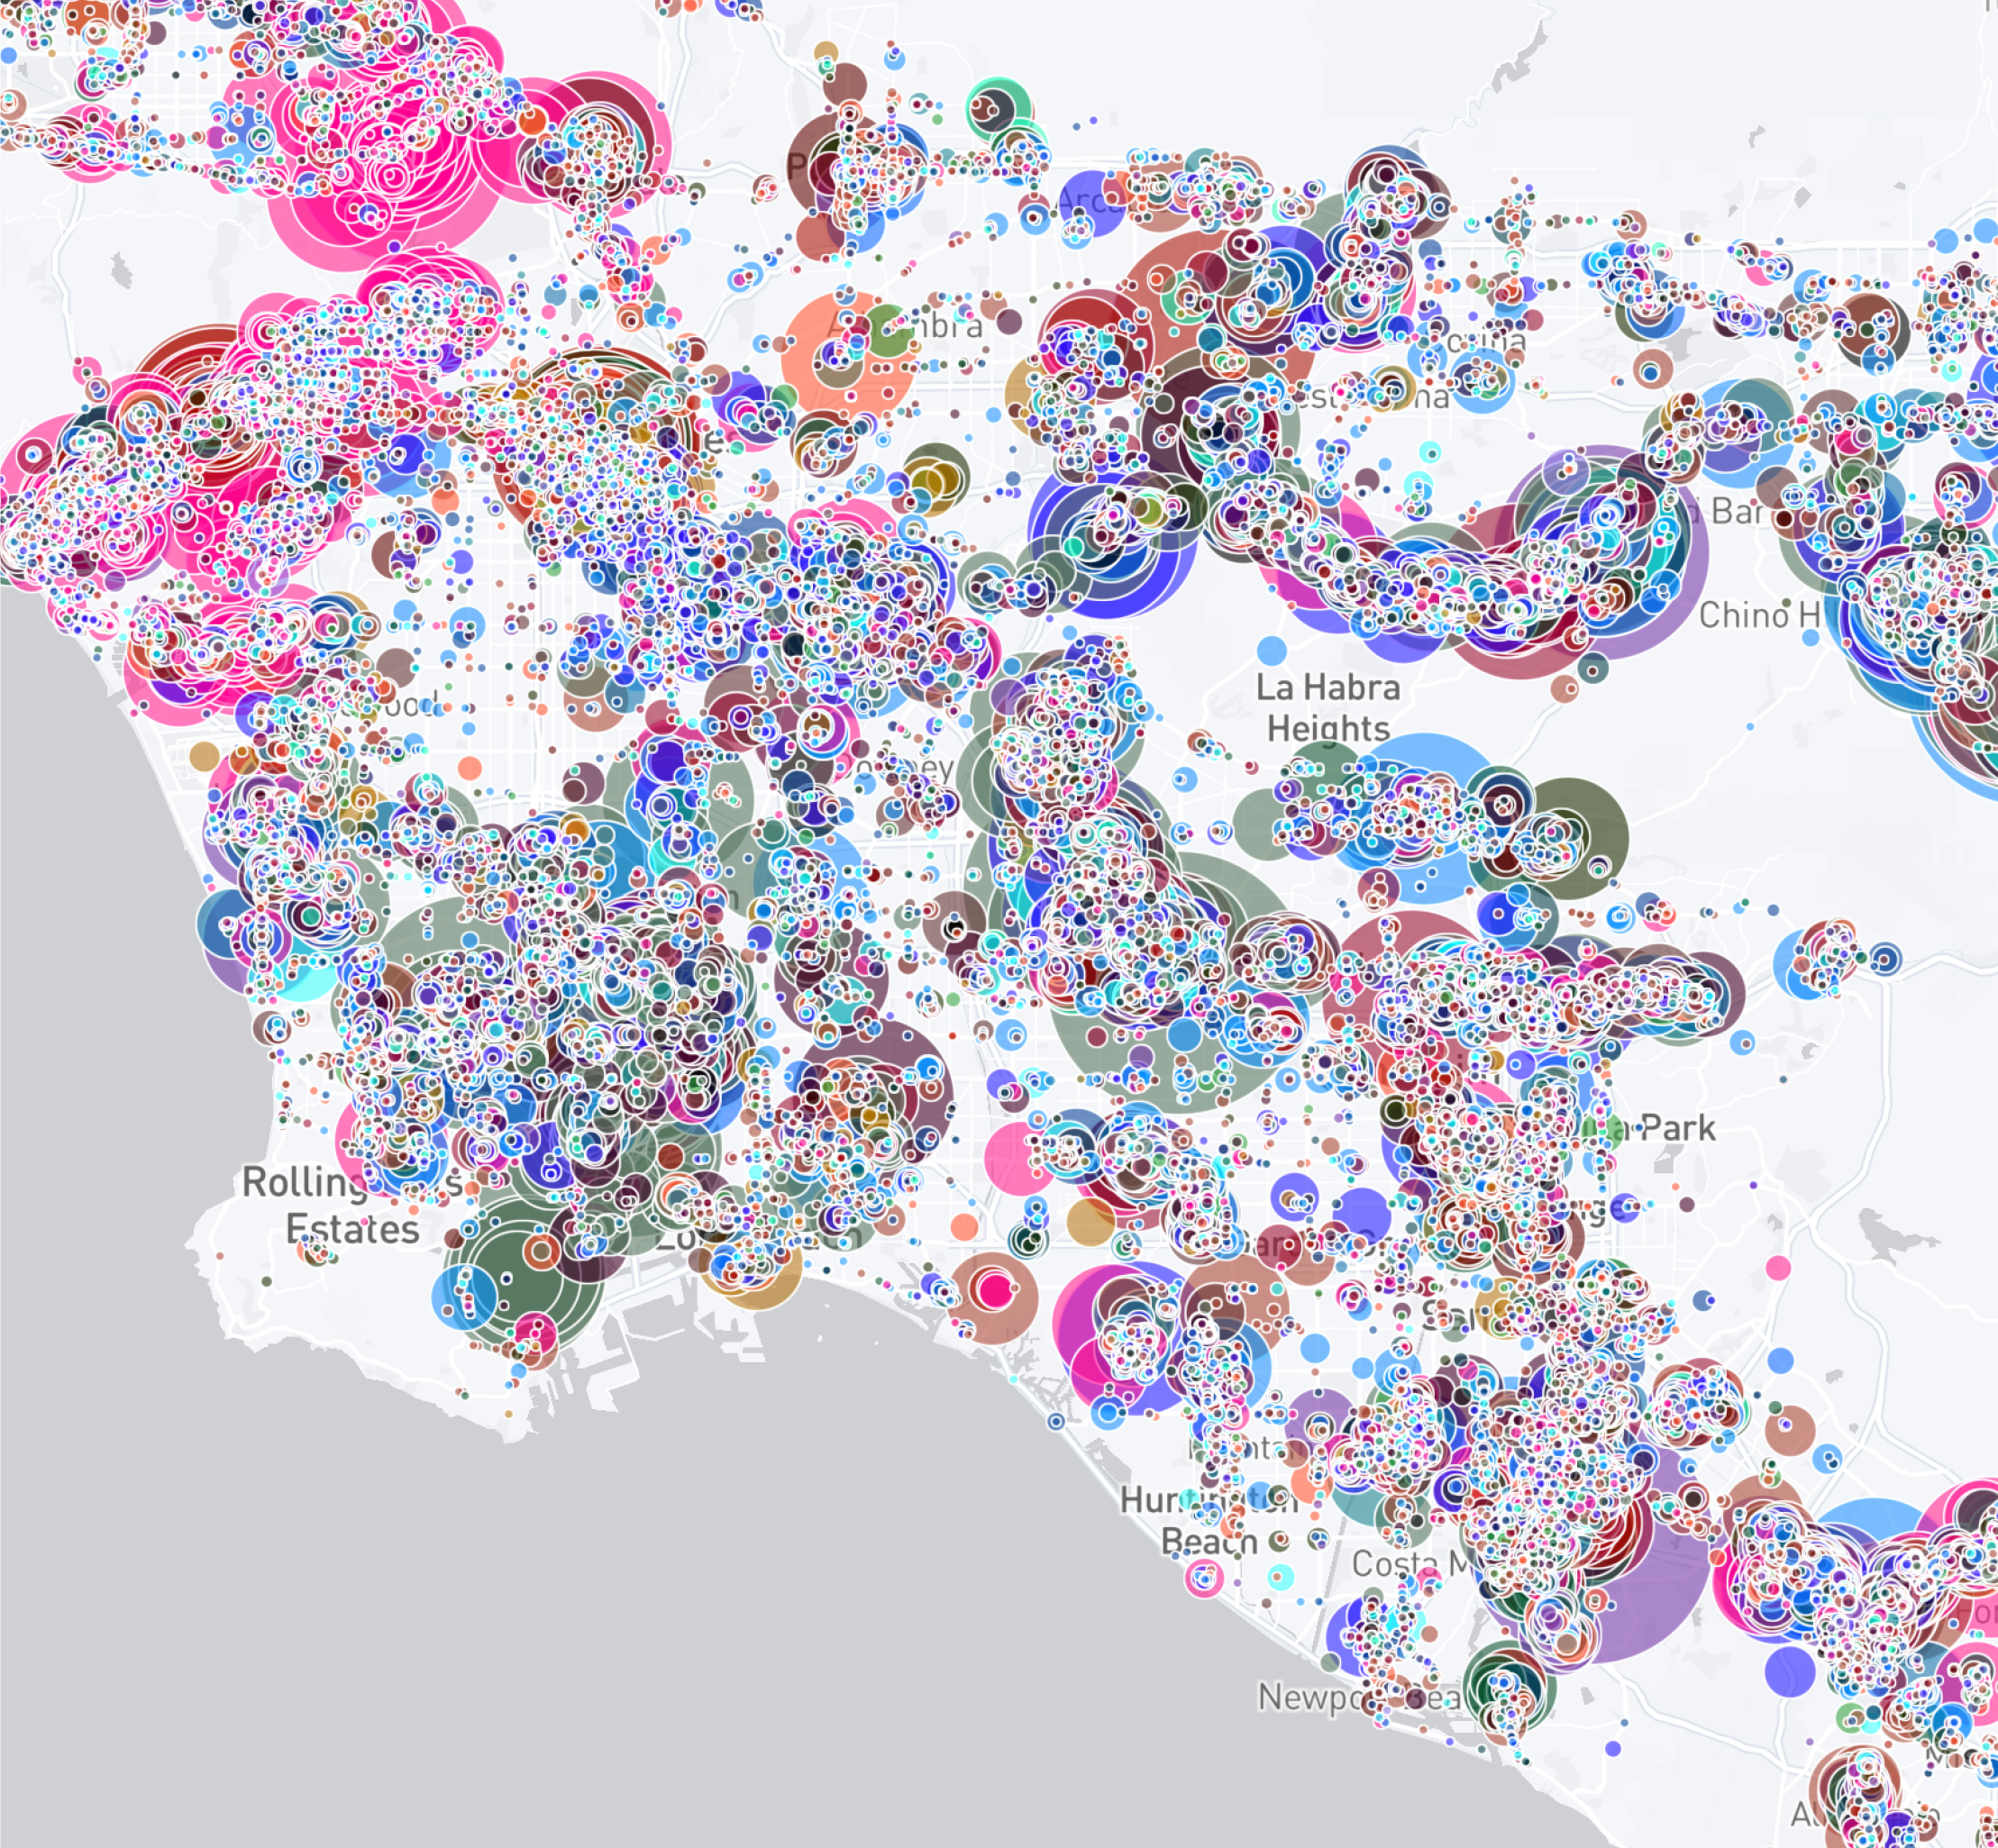
Tenant Industry: Visualize the concentration of tenant industries within a geographic area. |
|
|
Space Type: View the density of office, industrial, or retail space types by market. |
|
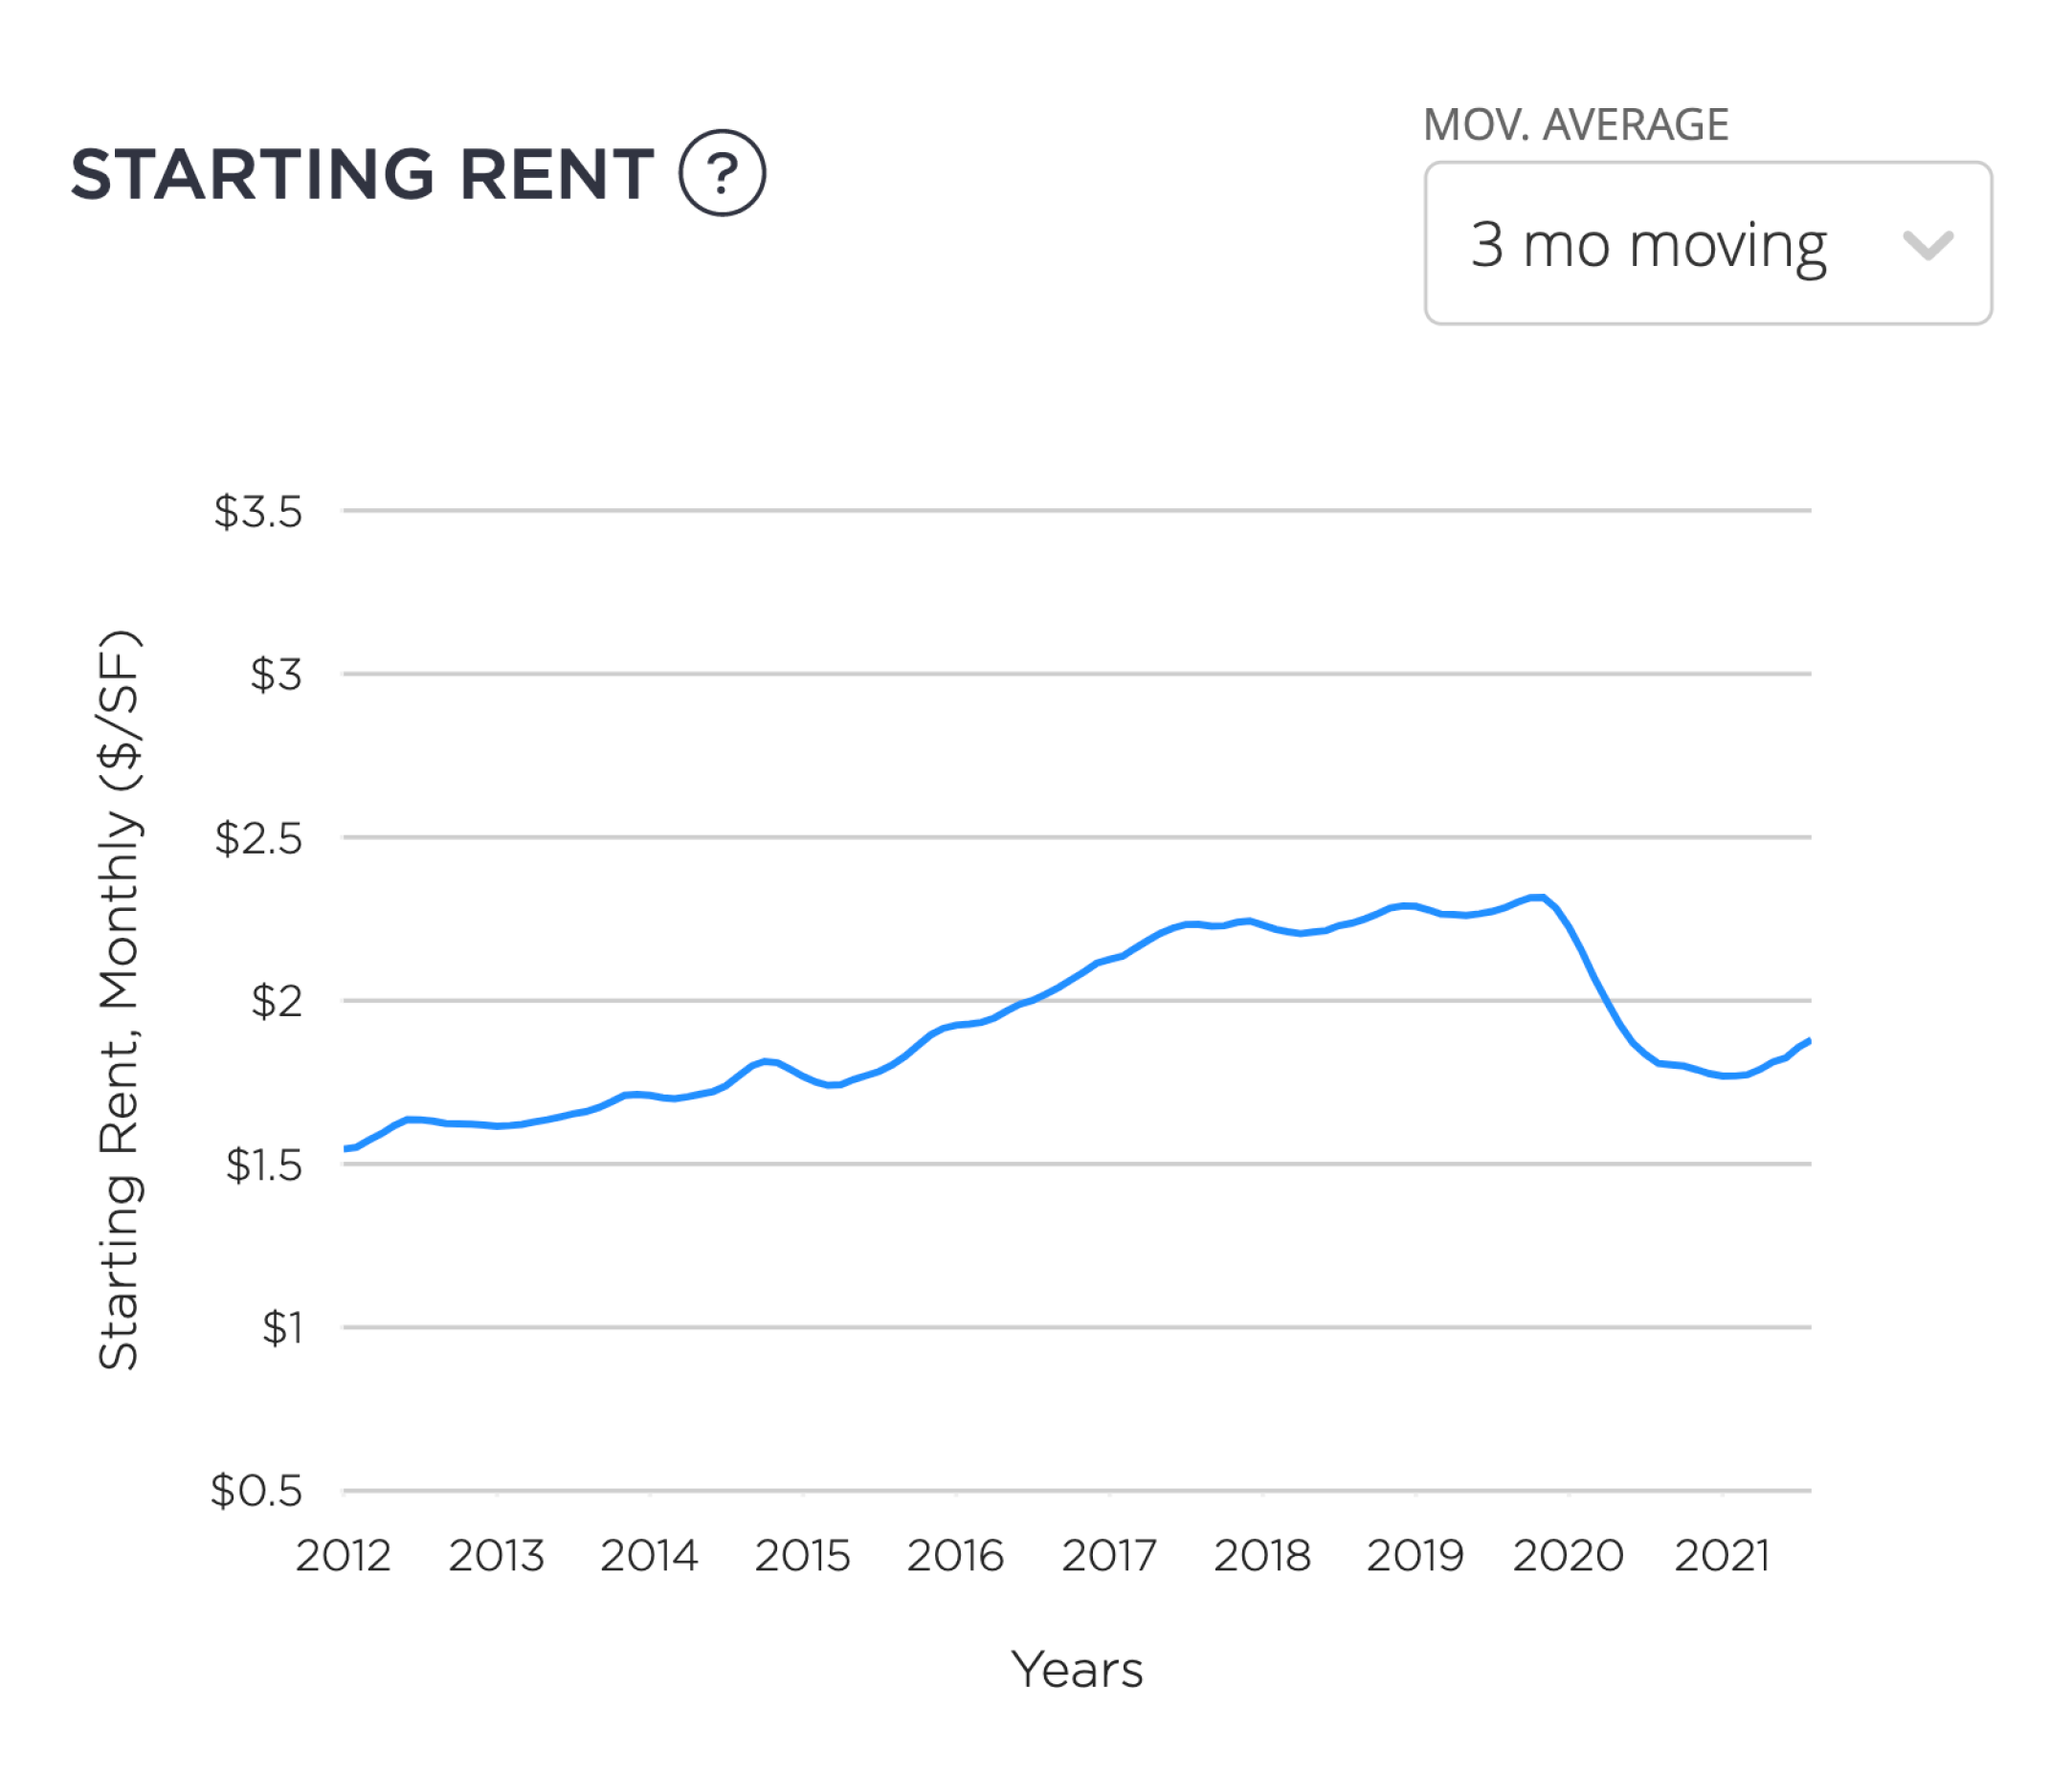
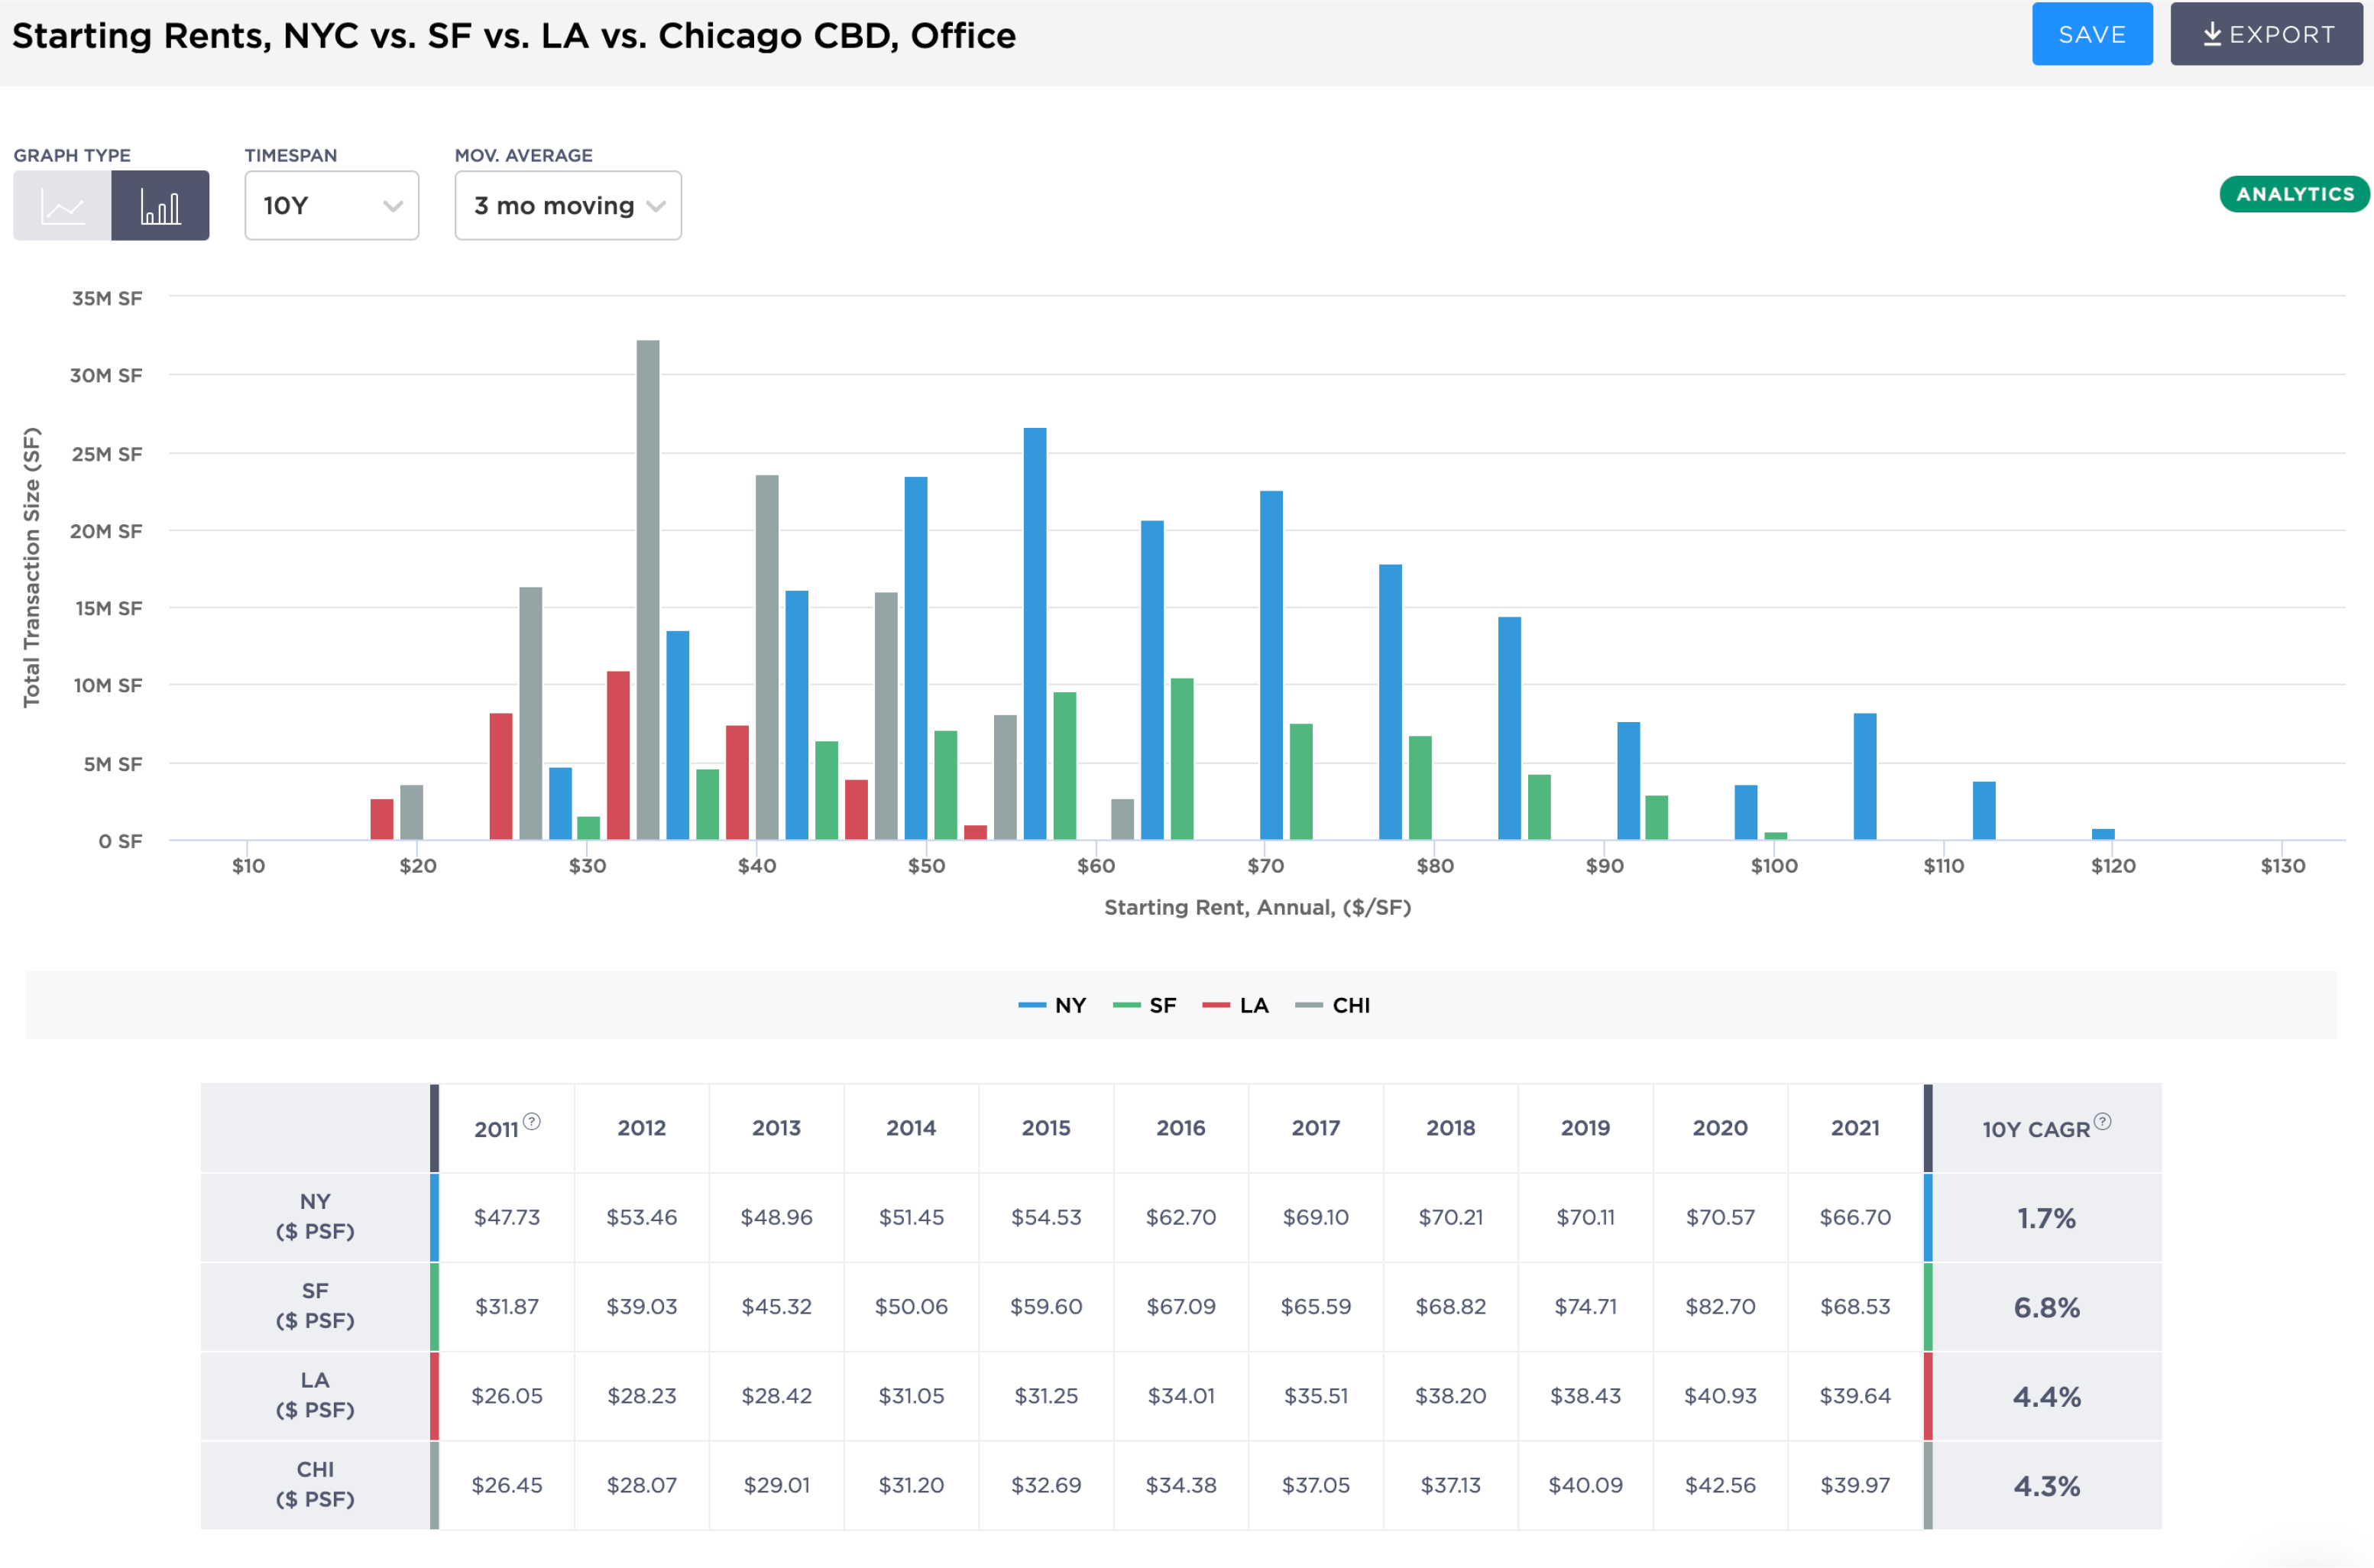
Starting Rent Trend: Explore historical starting rents, narrowing down results by specific submarkets and properties. Use the moving average tool to view averages for 3, 6, and 12 months. |
|
|
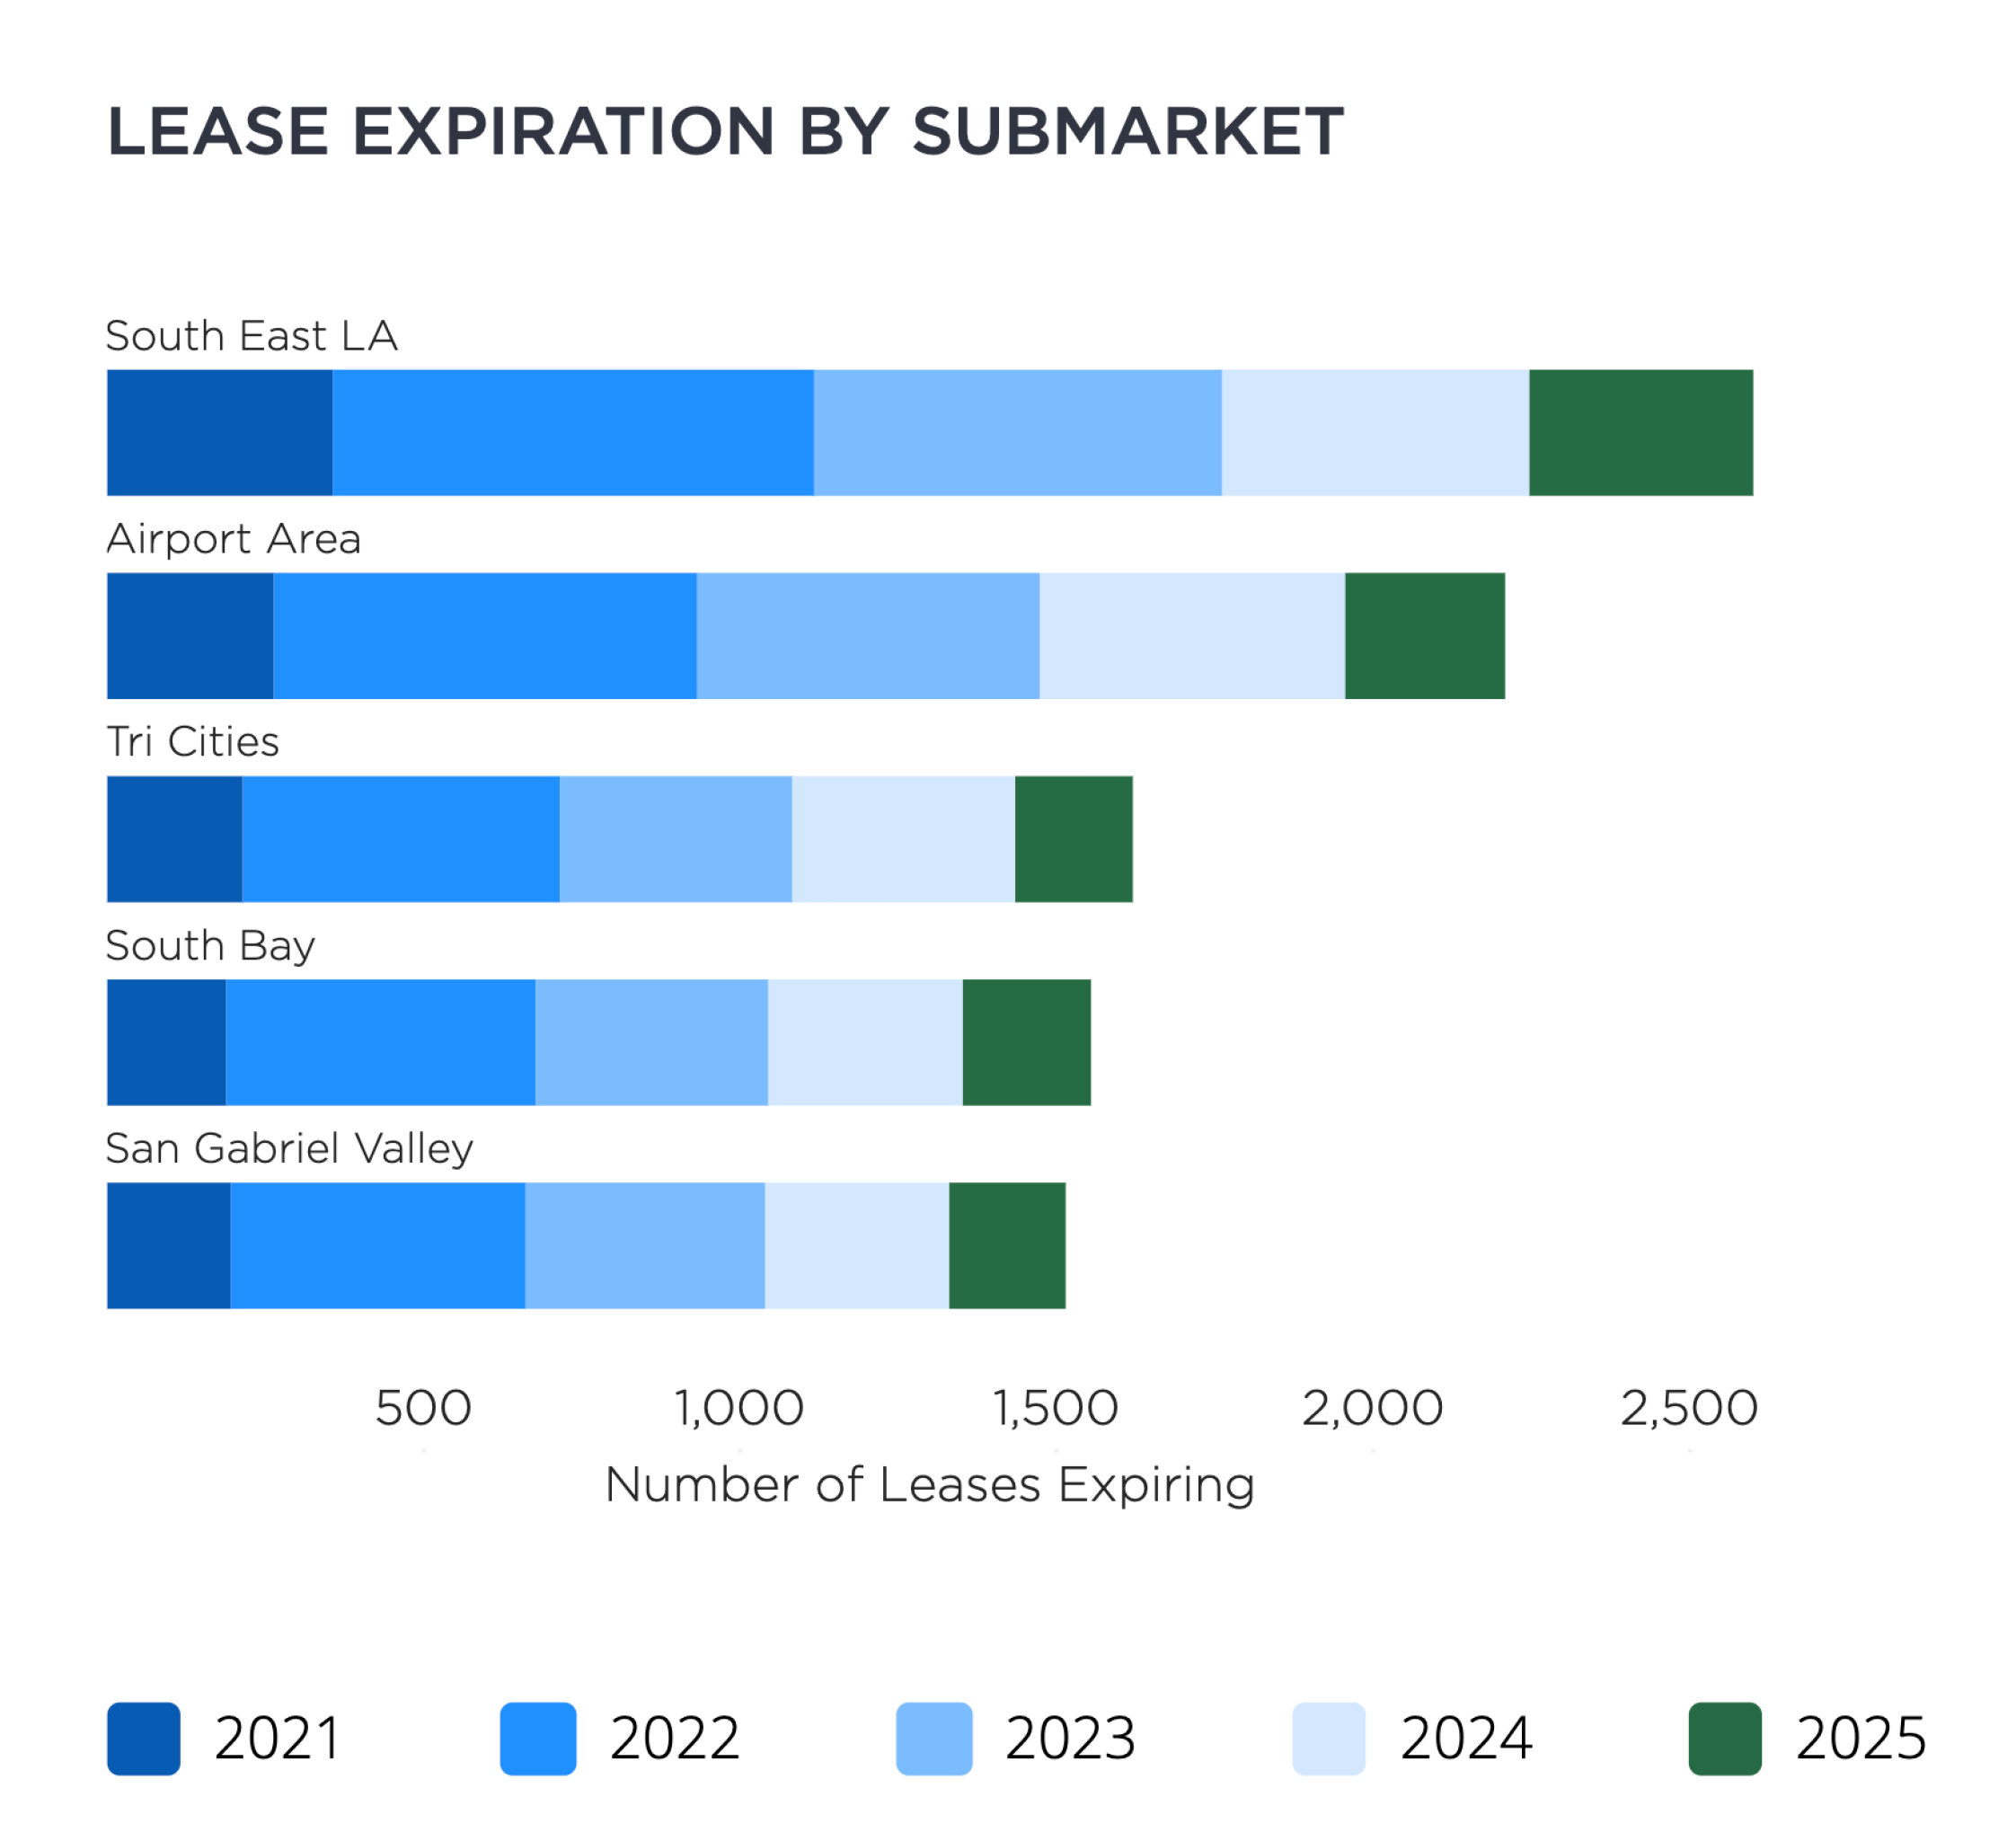
Lease expiration by property type & submarket: View upcoming lease expirations for the next 5 years by property type, submarket, and year. |
|
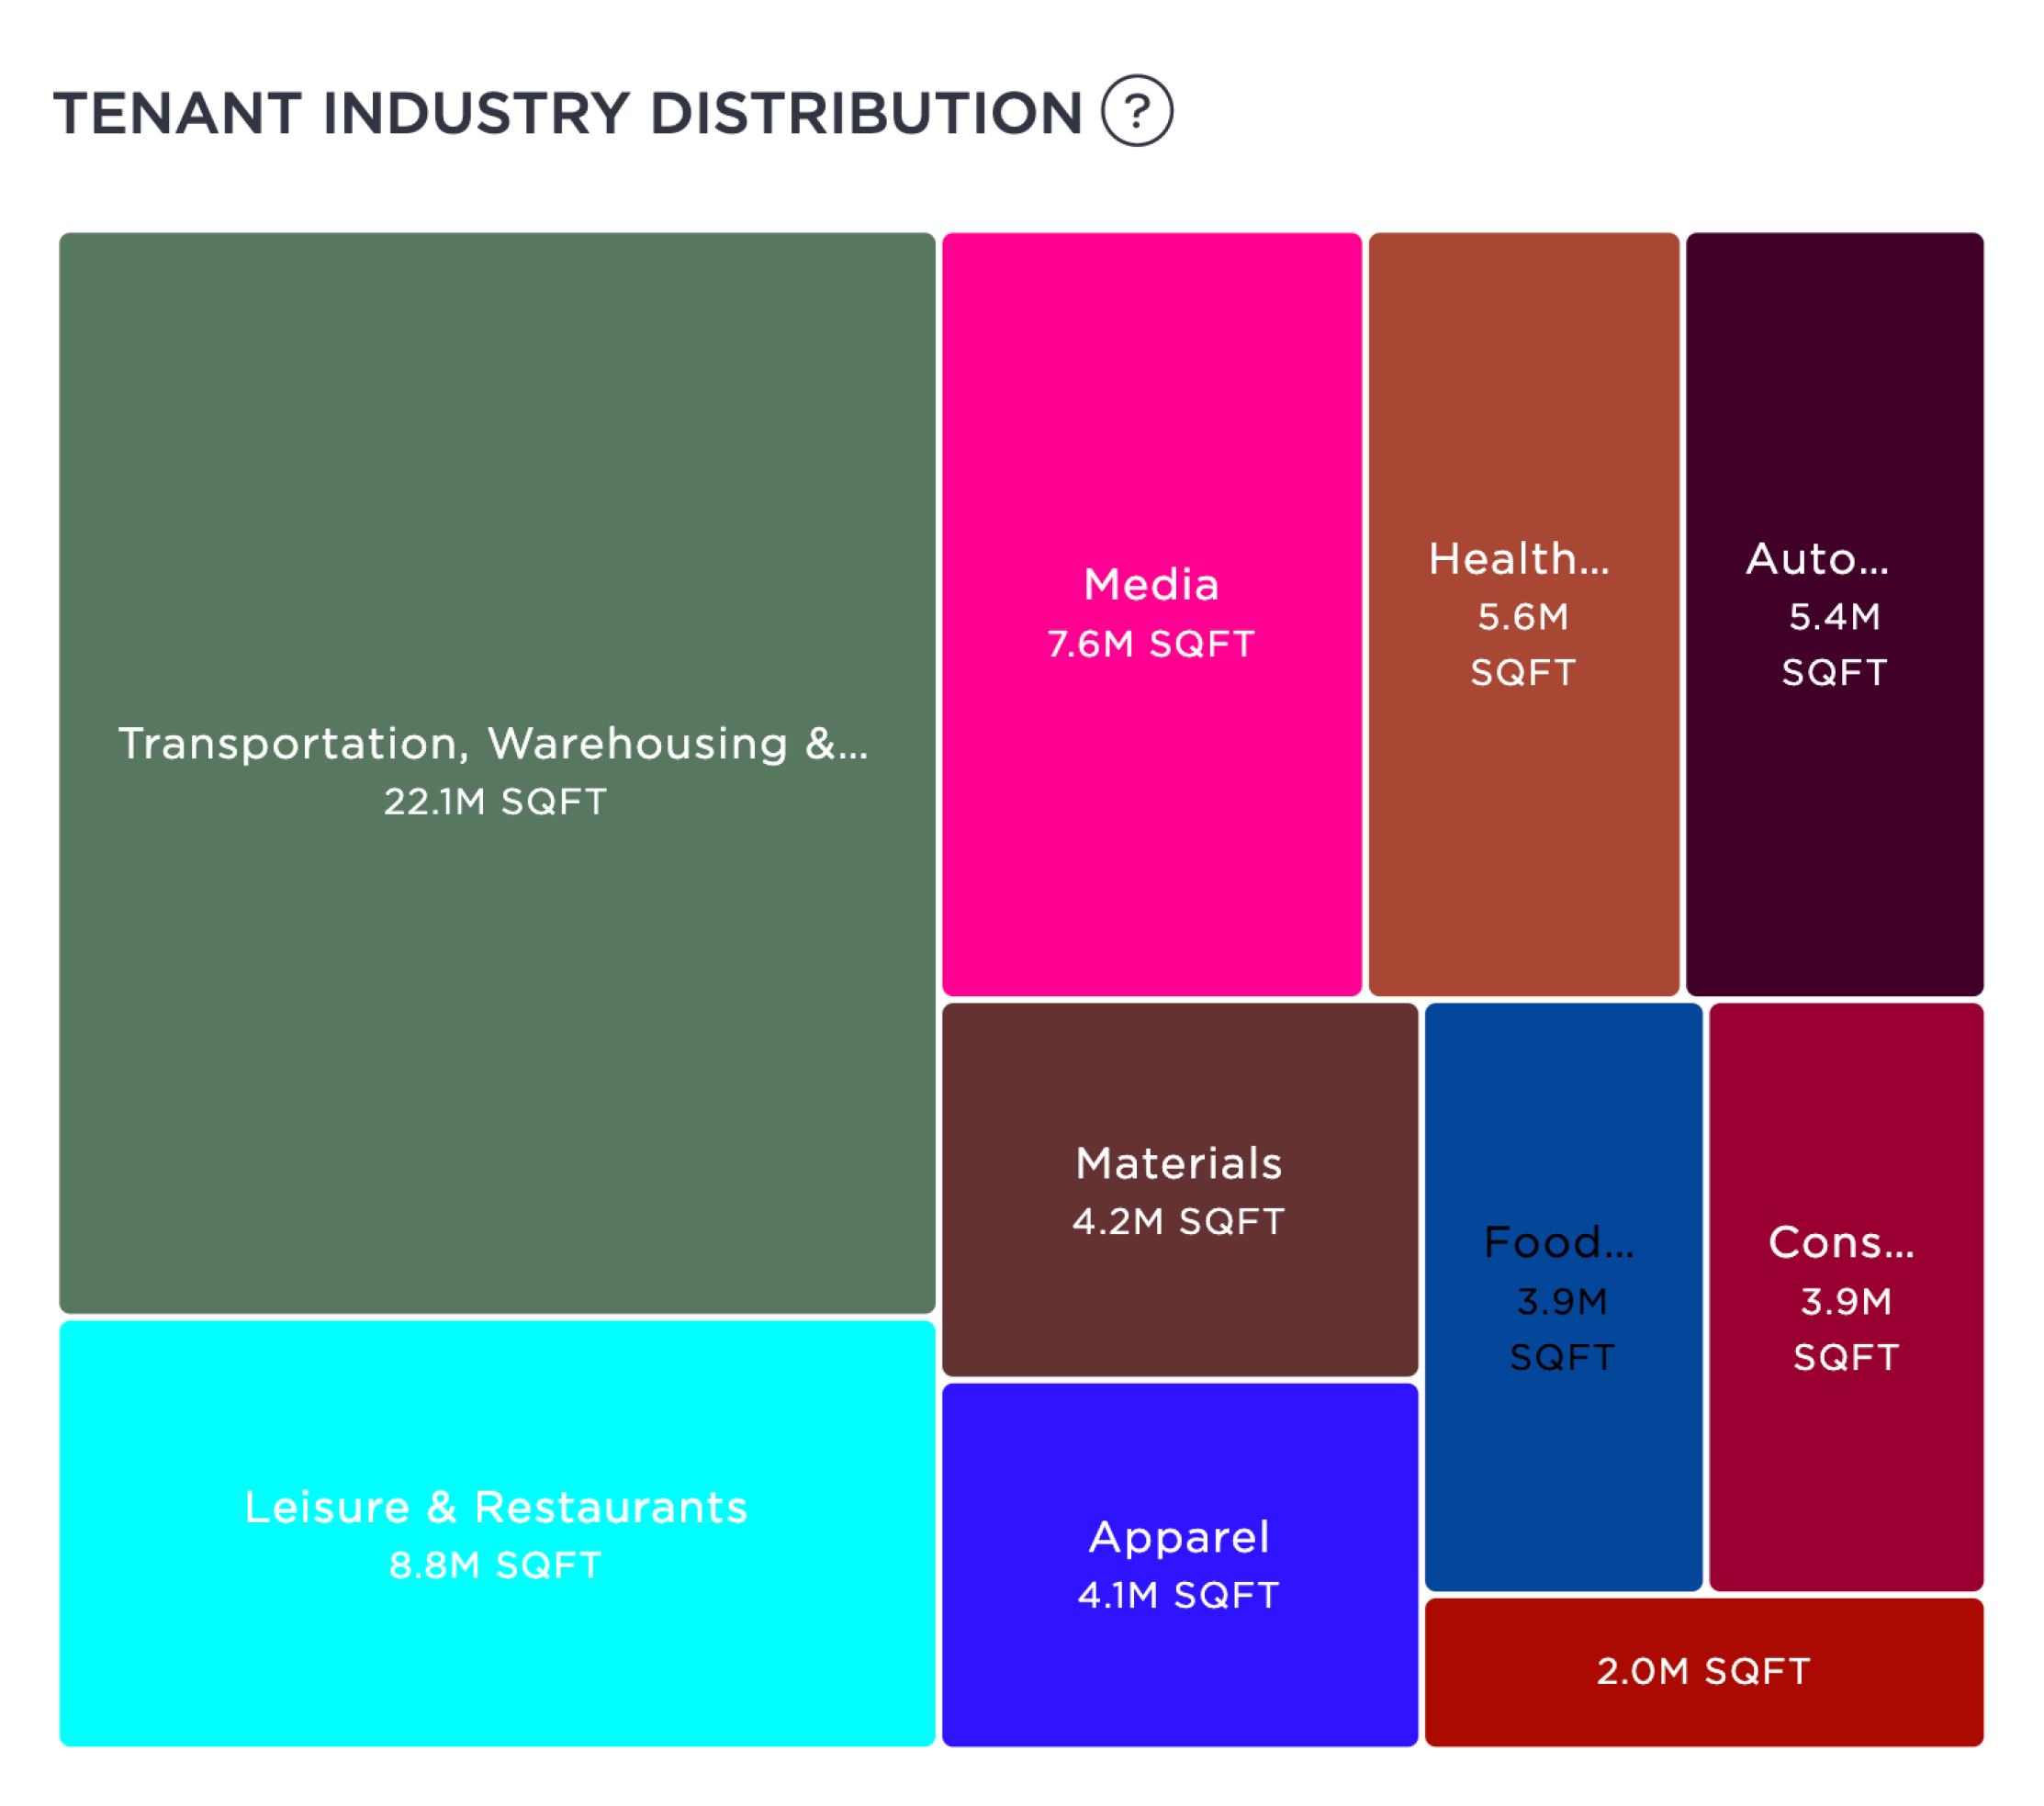
Tenant Industry Distribution: Contrast the relative sizes of the top ten industries with the selected geography. |
 |
|
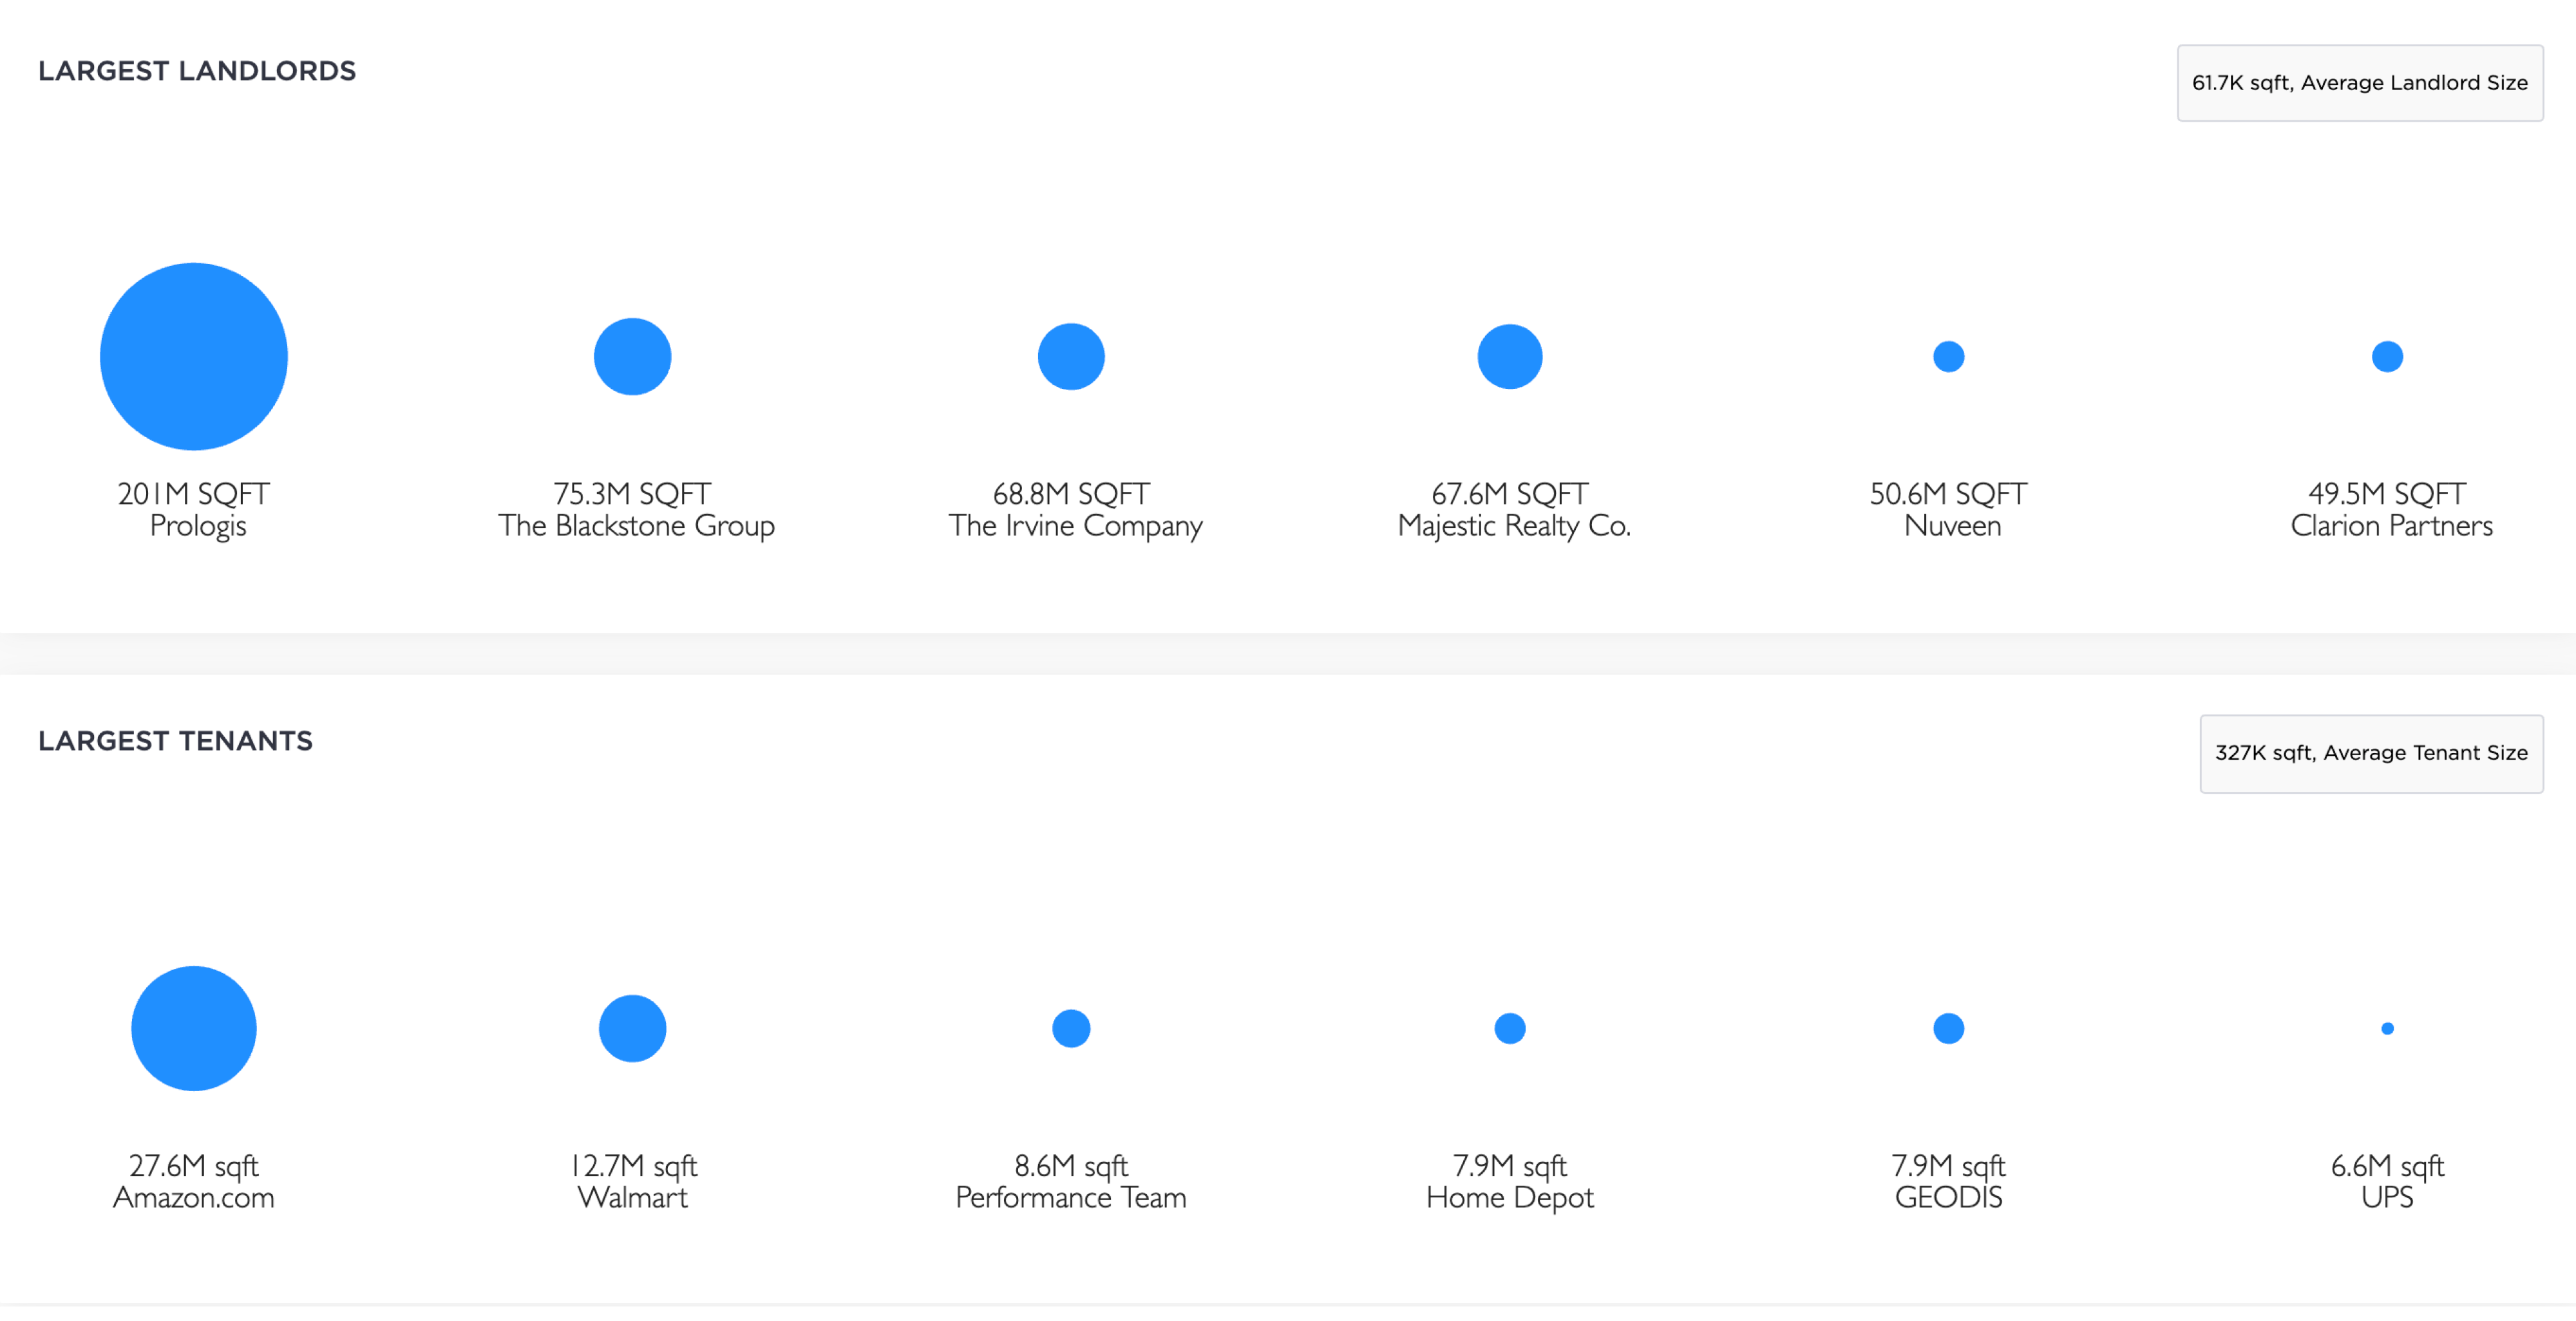
Top Landlords and Tenants: Visualize the top landlords and tenants within a specified geographic area based on the total sq footage. |
|
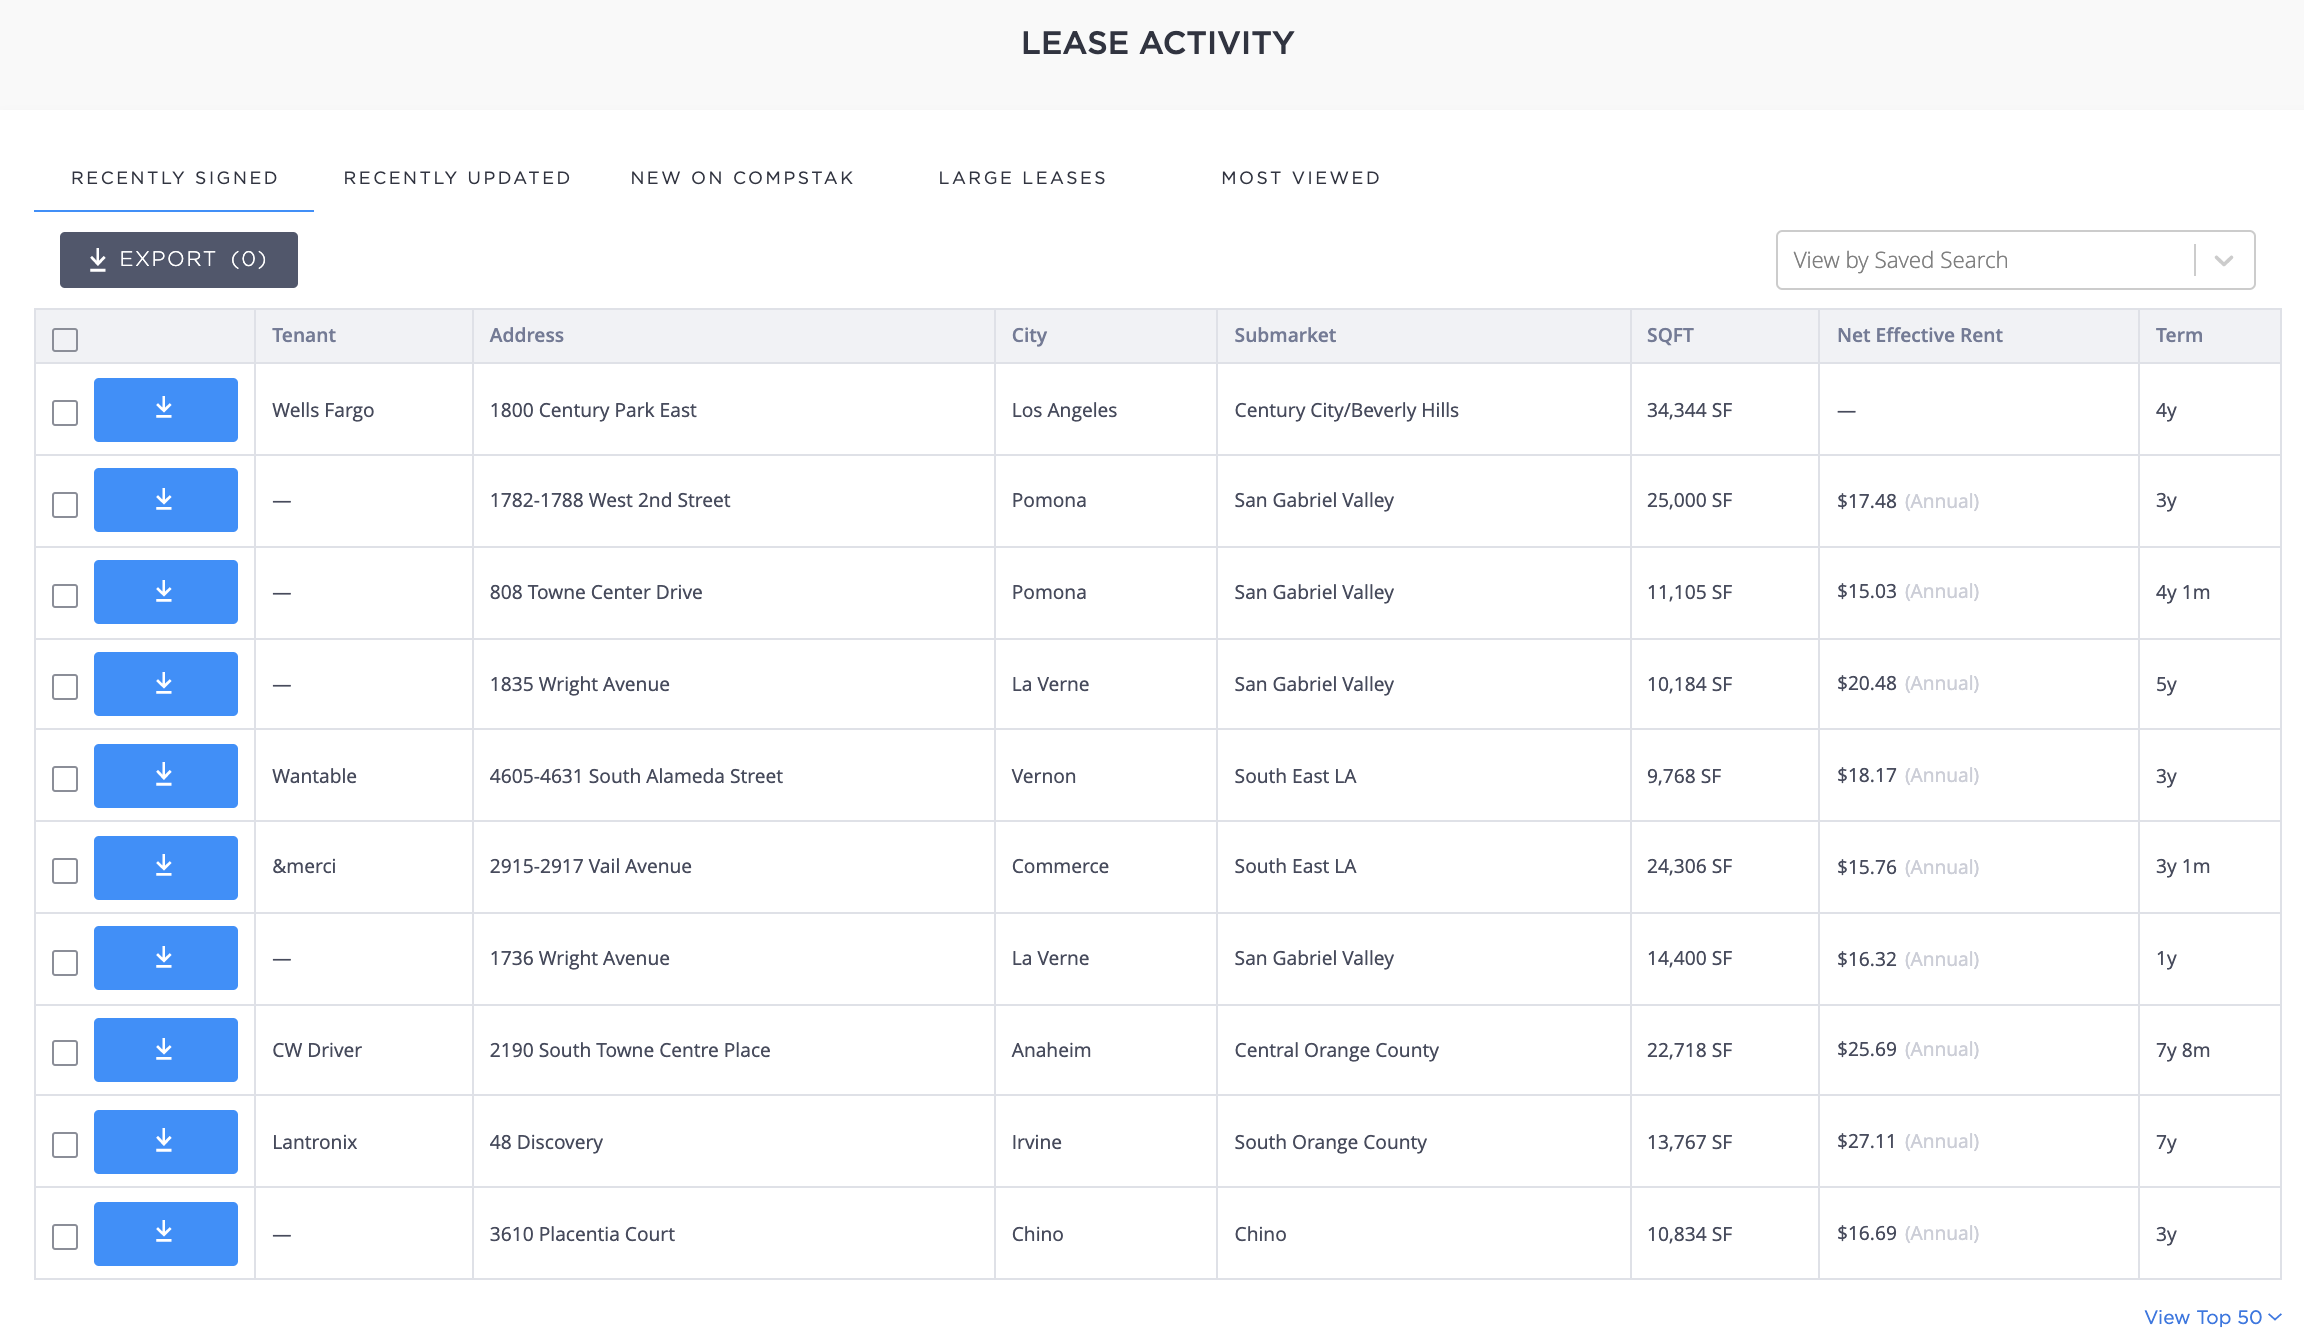
Lease and sales activity monitor: Monitor recent, market-moving, and notable lease and sale transactions to inform your leasing decisions. |
 |
|
Lease Distributions: Understand starting rent distributions to determine the appropriate starting rents for your deal. |
How to Get Started
CompStak Analytics Suite offers a wide range of discovery tools that allow you to enhance your decision-making process, get familiar with new areas, and uncover new investment opportunities. From granular property chart builders to a high-level market overview, integrate CompStak Analytics into your workflow.
Learn more about CompStak Analytics by requesting a demo today!
Related Posts

Product Update: The Full Picture with Multifamily Data

