Help us direct you to the right place to sign up

SKIP AHEAD TO
- Office occupancy and retail & recreation mobility levels vary across the United States
- Retail rents are down the most in the New York and Washington D.C metro areas
- Retail transaction volume shifted away from CBDs
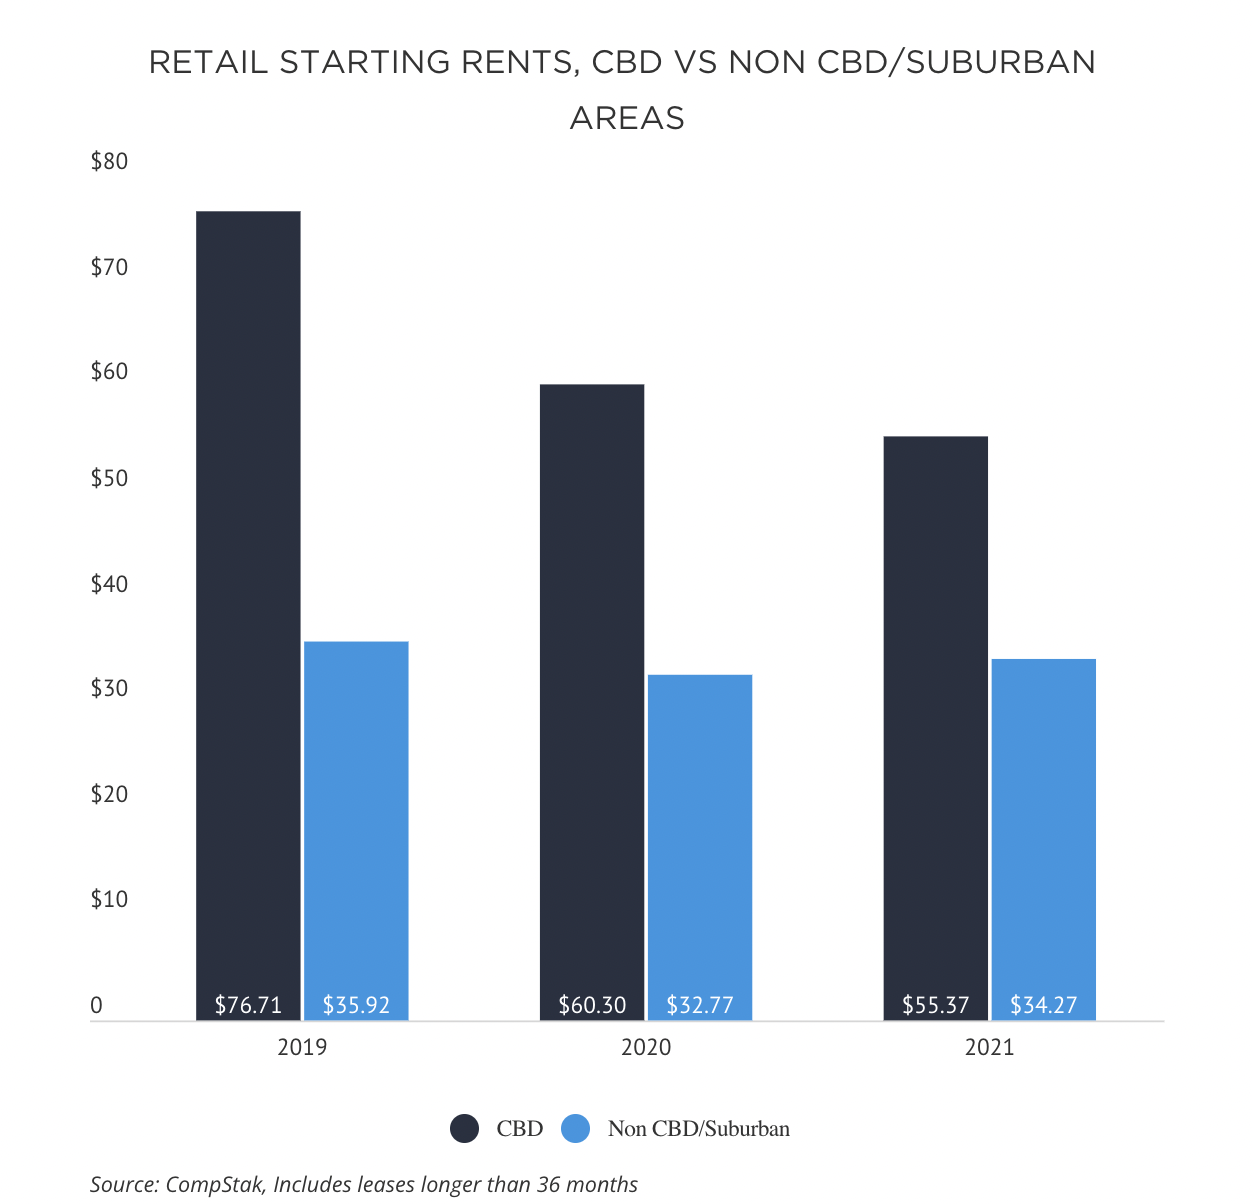
- Average retail starting rent in CBDs is trending down, while the average rent outside the CBD across ten metros areas is recovering
** This research piece is created with CompStak’s exclusive data
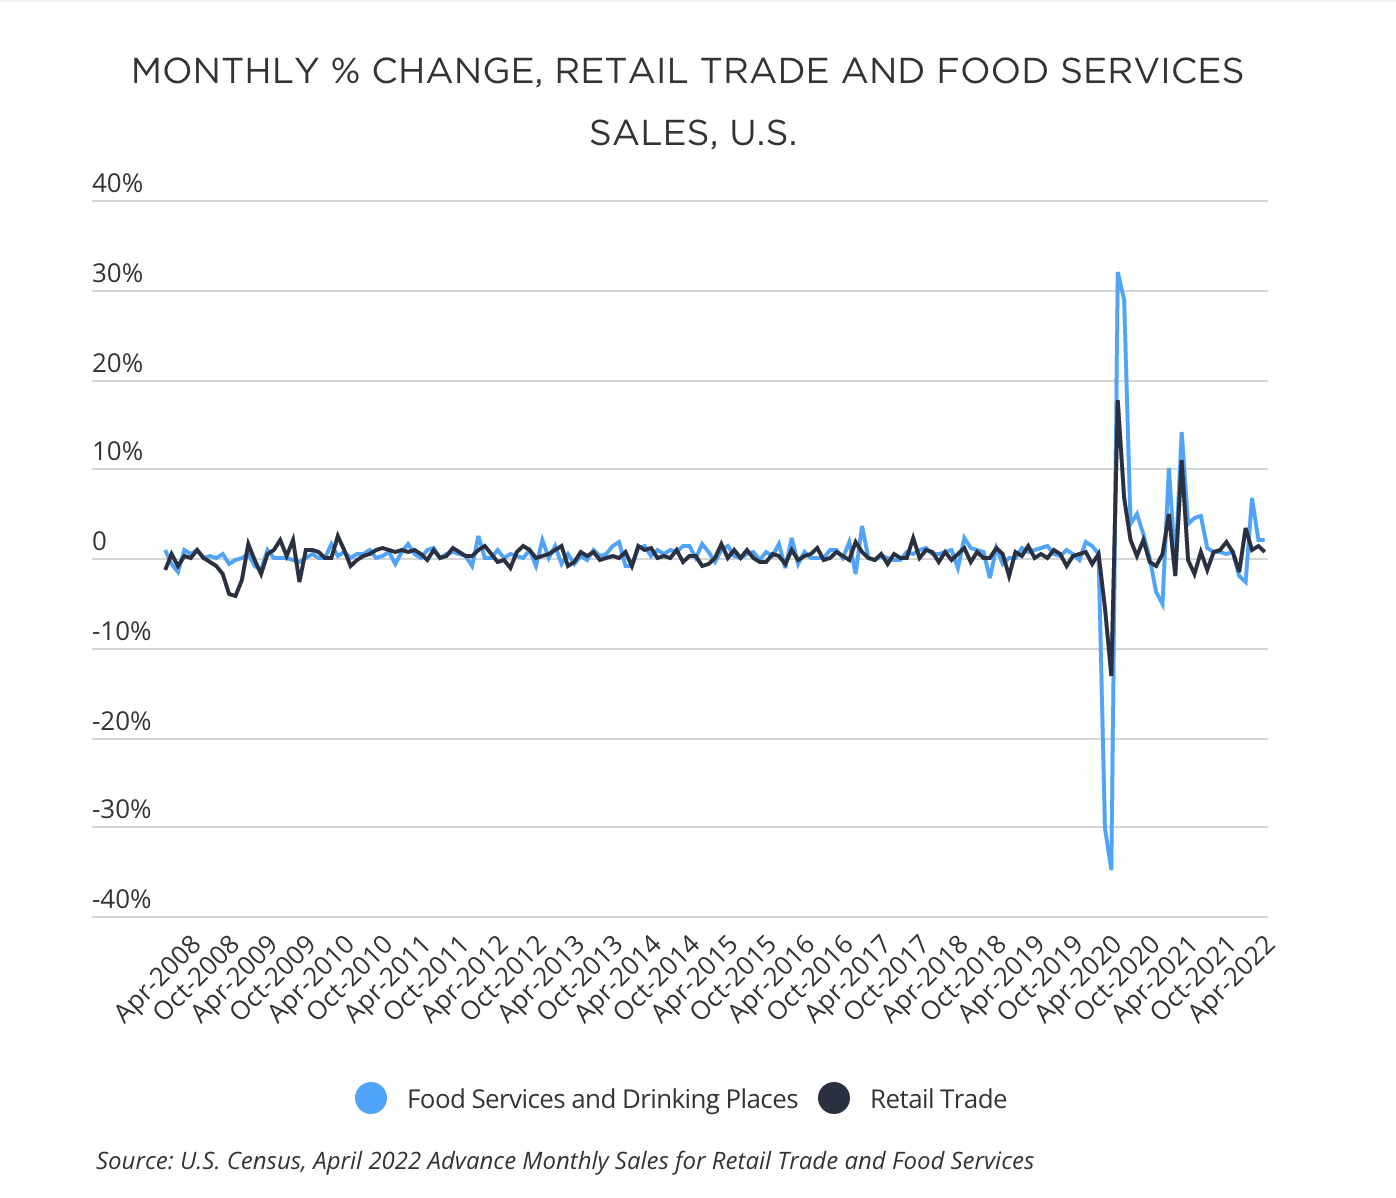
More than two years since the onset of COVID-19, it is clear that hybrid and remote work have staying power and have transformed the lifestyles of American office workers, leading to weakened demand for office space, reduced public transit use and altered patterns of retail consumption. Monthly sales for retail and restaurants have rebounded from the pandemic low in April 2020, and posted three straight months of growth in 2022, even as inflation threatens to dampen purchasing power. At the same time, remote work continued to weaken retail recovery in central business districts (CBDs) and retail activity shifted to denser residential neighborhoods and suburban areas.
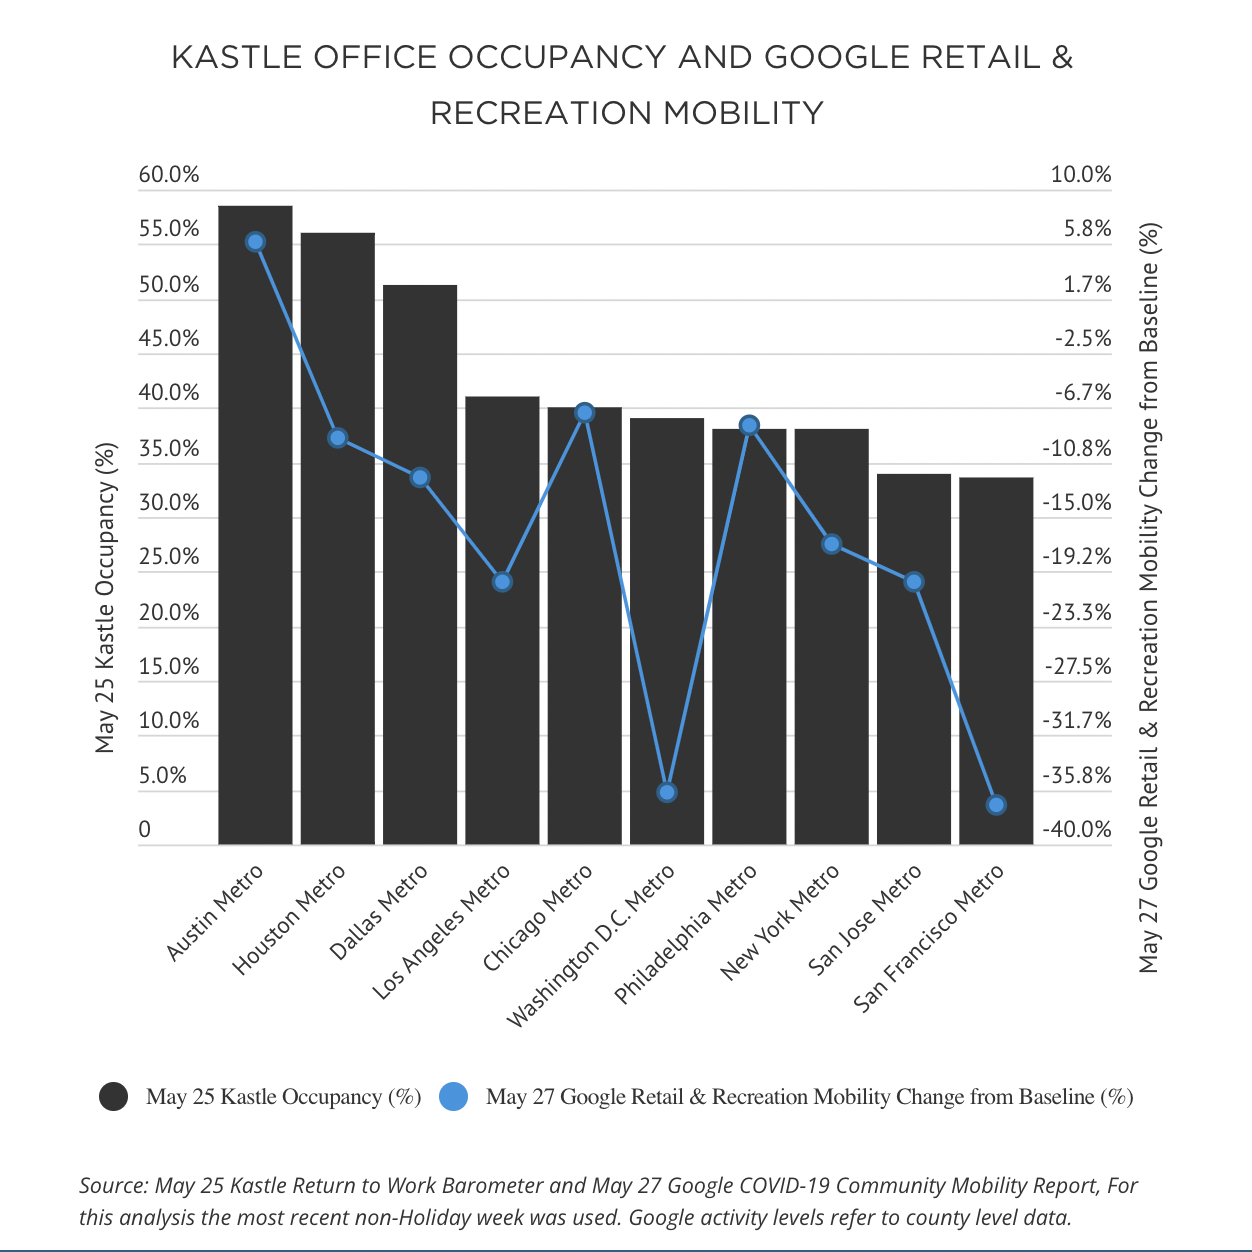
Office occupancy and retail & recreation mobility levels vary across the United States
To date, U.S. metro areas have varied in their return to office level with the top ten markets tracked by the Kastle Back to Work Barometer averaging 42.9% the week ending May 25. These metros vary from a nationwide high of <strong>58.5% in Austin Metro to a low of 33.6% in San Francisco Metro</strong>. Similarly, Google’s mobility data shows that visits to retail and recreation (including places like restaurants, cafes, shopping centers, theme parks, museums, libraries, and movie theaters) is up 6% from the baseline in Austin but remains down by 17% and 37% in New York and San Francisco, respectively.
Using CompStak’s exclusive data, we compared retail transactions and rent growth in markets across the ten top ten metros tracked by Kastle and analyzed how suburban and CBD retail have trended differently, especially in some markets with higher levels of remote work.

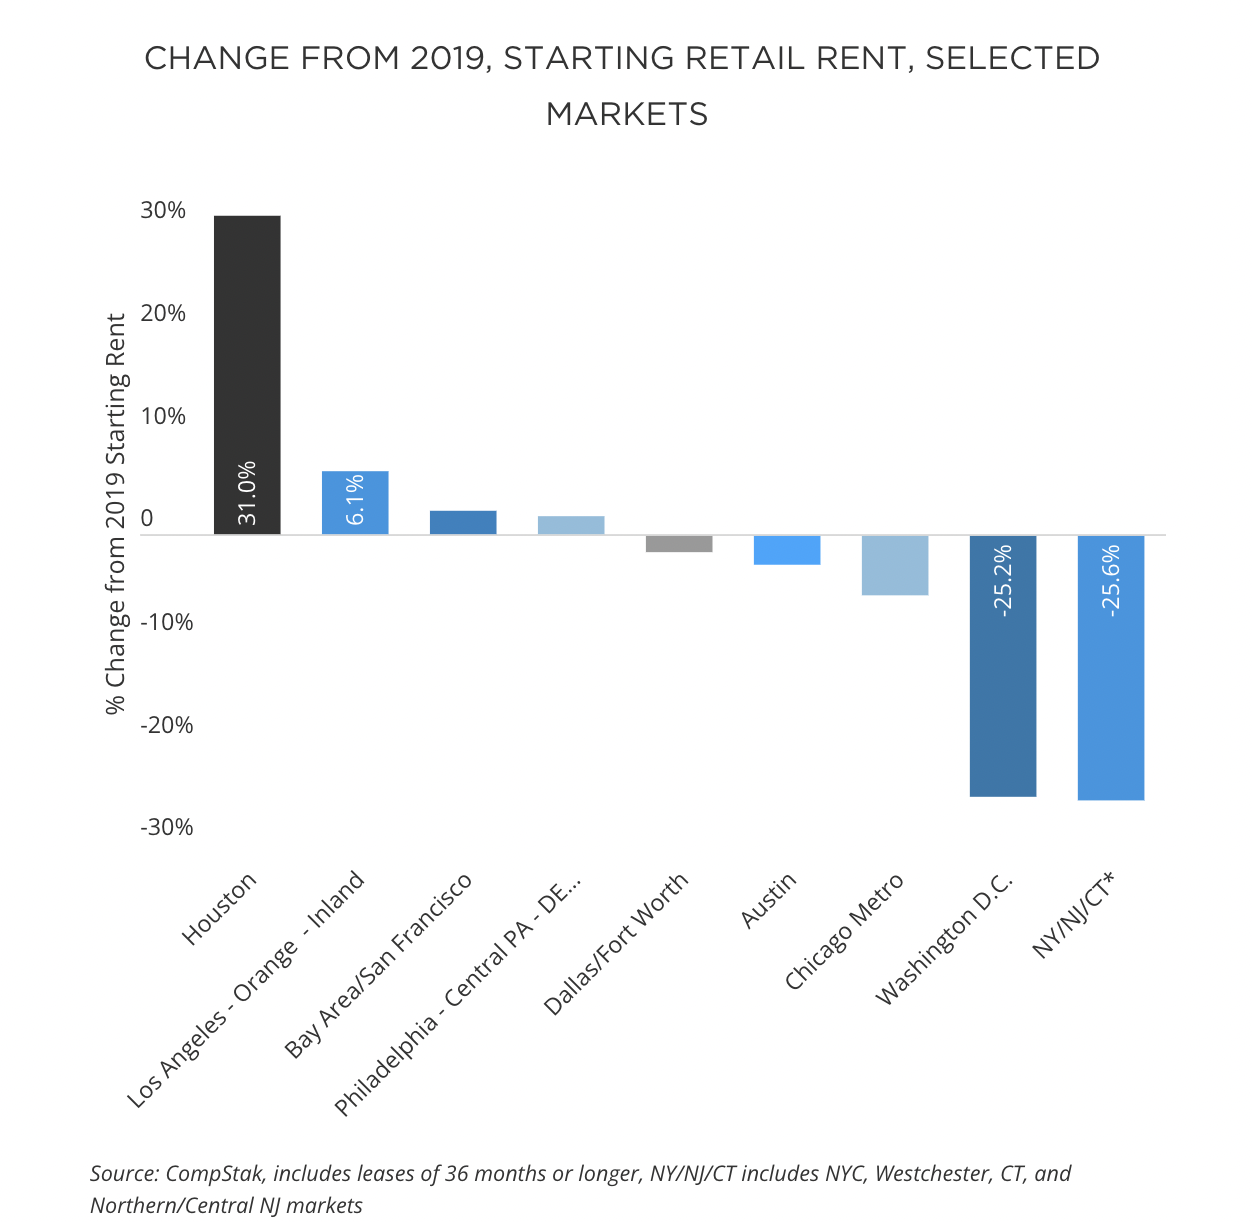
Retail rents are down the most in the New York and Washington D.C metro areas
From 2019 to 2021, four of these ten markets demonstrated an improvement in average starting retail rents, according to CompStak data. Starting retail rents increased since 2019 in Houston and Los Angeles metro areas where office occupancies ranked 2nd and 4th among the top ten tracked Kastle markets nationwide. Similarly, retail rents are down the most in the New York metro area, which ranks third lowest nationwide for office occupancy. However, retail starting rents are up slightly in San Francisco/Bay Area, where office occupancy is 33.6% and 33.9% in San Francisco and San Jose, respectively.
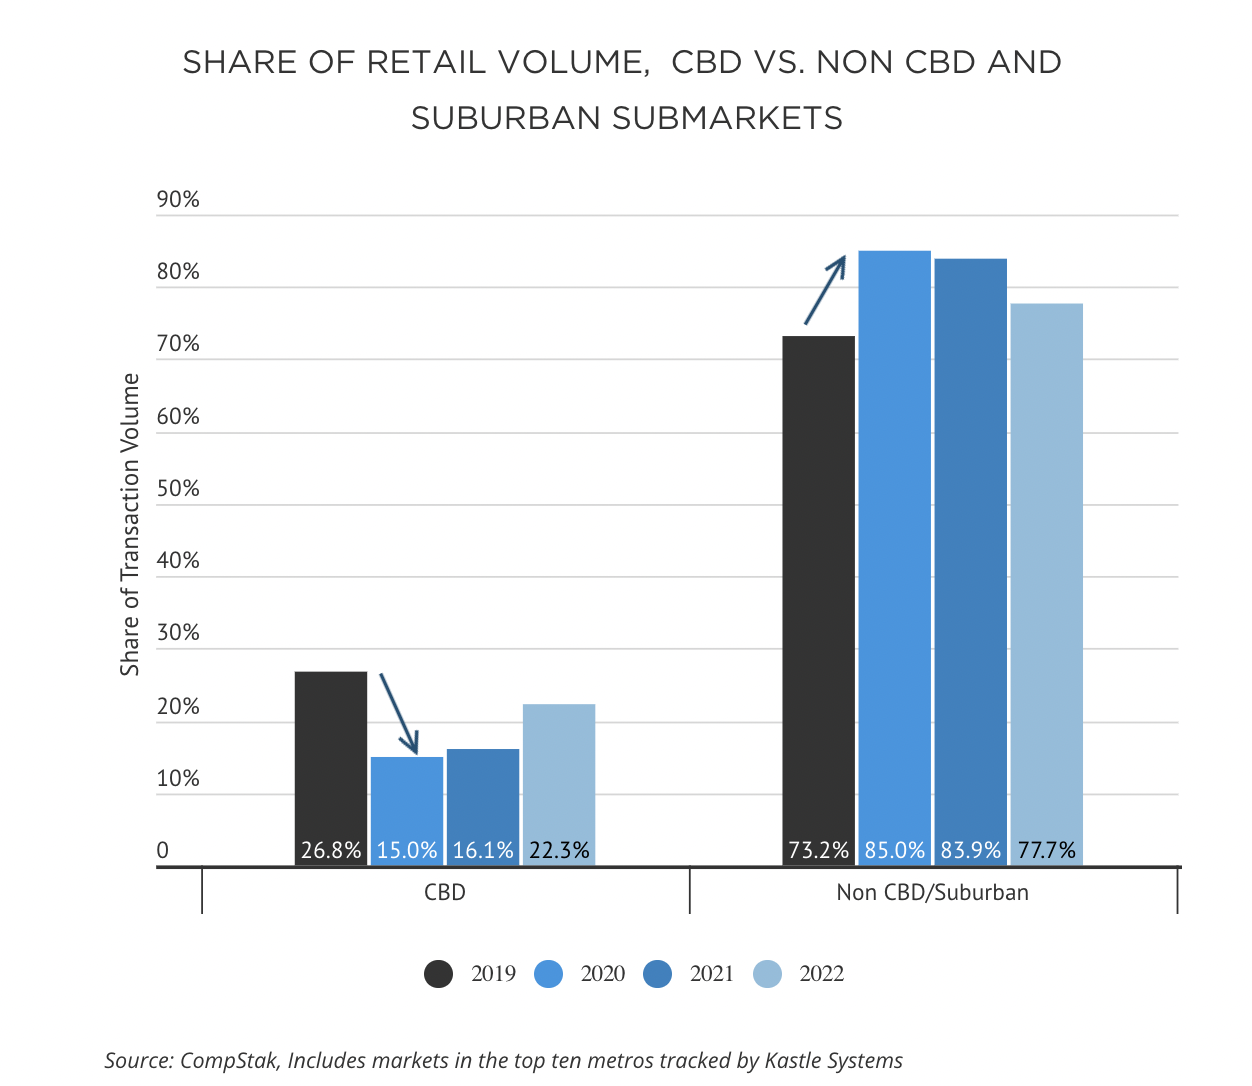
Retail transaction volume shifted away from CBDs
While remote work remains dominant in many major metros, more people are shopping and dining where they live instead and a retail recovery in central business districts has lagged. CompStak’s data demonstrated a shift in retail transaction activity from CBDs to residential urban neighborhoods and suburban submarkets over the last three years. In 2020, the CBDs in the top ten metro areas accounted for an 16.1% share of retail transactions tracked by CompStak, down from 26.8% share in 2019.
Average retail starting rent in CBDs is trending down, while the average rent outside the CBD across ten metros areas is recovering
Dividing metro areas into CBD and Non CBD/Suburban geographies provides greater clarity on rent trends. Overall, retail starting rents are down 4.6% from 2019 to 2021 in the non CBD and suburban submarkets across the ten markets analyzed. The average CBD starting retail rent declined 27.8% over the same time period. The average starting rent for Non CBD/Suburban areas is up from 2020, while the CBD average declined for the second year.
Retail in office-centric downtowns has been challenged over the last two years. According to CompStak’s data, a roadmap for reaching pre-pandemic levels is unclear without the demand from a larger return of office workers, tourists, and daily commuters. Want to monitor recovery in CBD retail and suburban retail growth amid continued remote work? Request a demo to get started with CompStak for more retail trends and insights.
Related Posts
MARKET INTEL: Taking the Temperature of the SoCal Industrial Market: Q4 Insights with AIR CRE

MARKET INTEL: Taking the Temperature of the SoCal Industrial Market: Q4 Insights with AIR CRE
MARKET INTEL: 3 Major CRE Trends Since COVID Began

MARKET INTEL: 3 Major CRE Trends Since COVID Began
MARKET INTEL: Circling the DMV: 3 Major Influences on the Office Market
