Help us direct you to the right place to sign up

In the current CRE landscape, being able to leverage relevant data to make more informed decisions and increase productivity is critical. At CompStak, our comprehensive suite of commercial real estate transaction data and research tools has many useful applications such as validating market leasing assumptions and prospecting for new opportunities.
Utilizing CompStak’s Market Dashboard, users can evaluate current and historical data to spot trends and uncover market insights by monitoring recent deals and market-moving transactions.
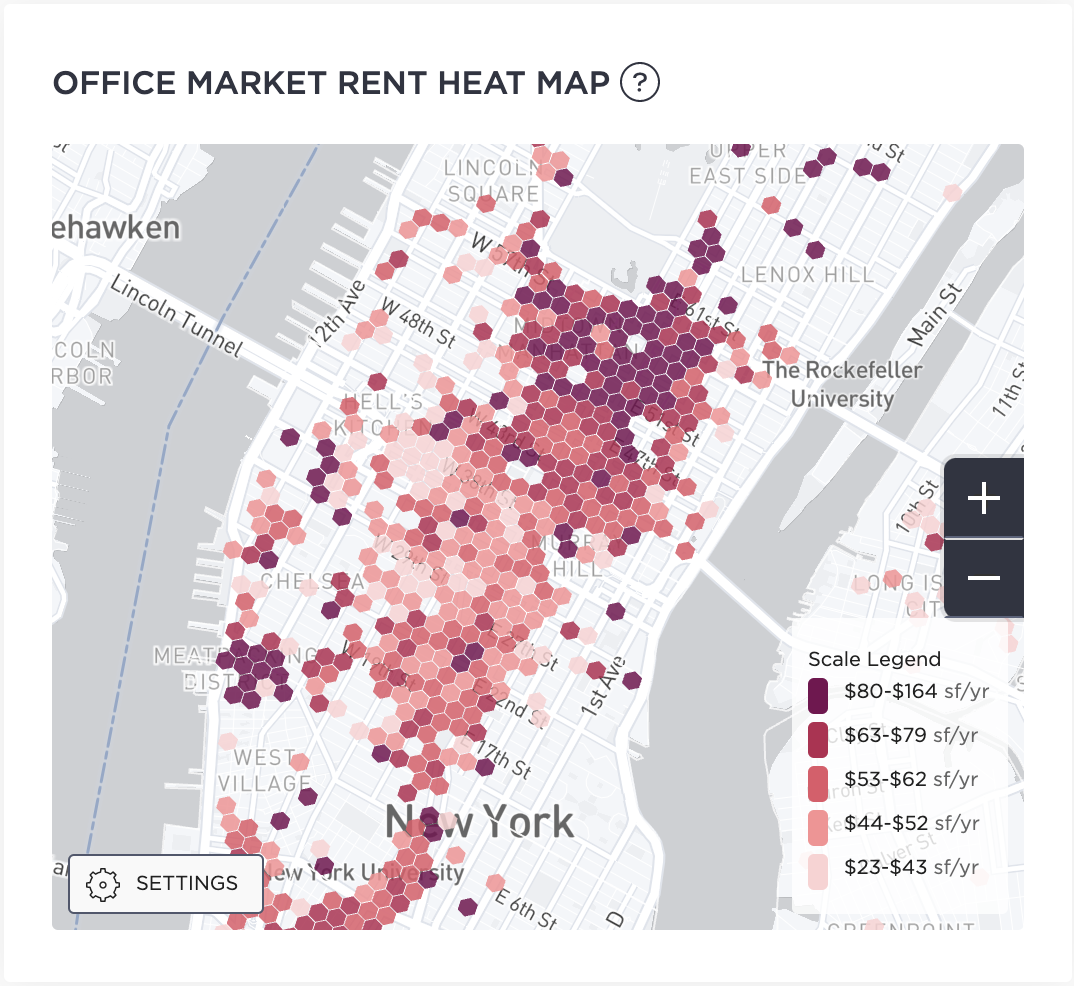
In the following example, we compared several submarkets in Manhattan. First, by viewing the Market Rent Heat Map for starting or effective rents, it is easy to identify submarkets or a group of properties that have rents either in line with the market or listed at a premium or a discount.

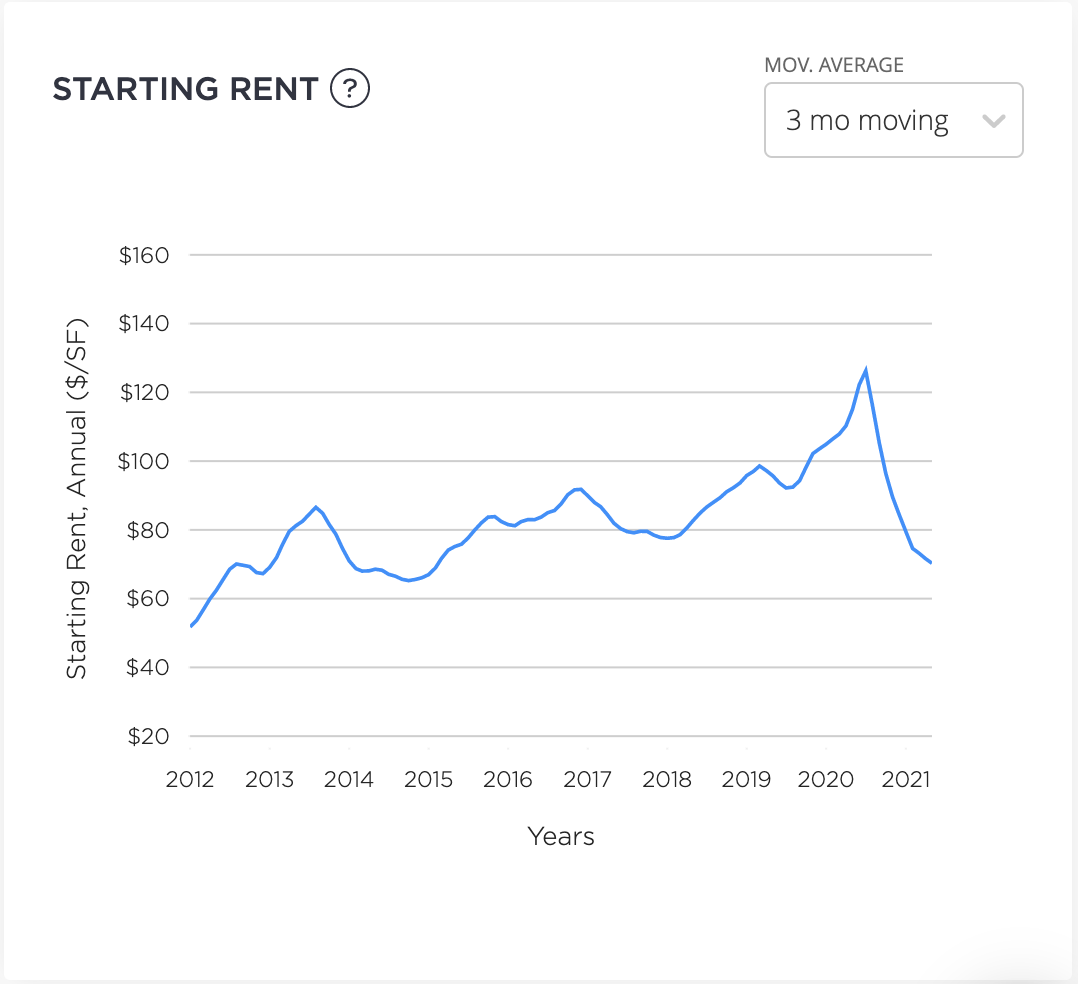
Taking a deeper look at that individual submarket gives more clarity. You can see why the rents diverge from the rest of the market and get a more granular view of recent lease activity. Users can utilize the Starting Rent module to compare rents in Gramercy / Union Square to nearby submarkets to see if the spike in rent for the selected properties is recent or a continuation.
When prospecting for potential tenants, it is important to know the number of leases and square feet expiring as well as the distribution of tenant industries in a given location.
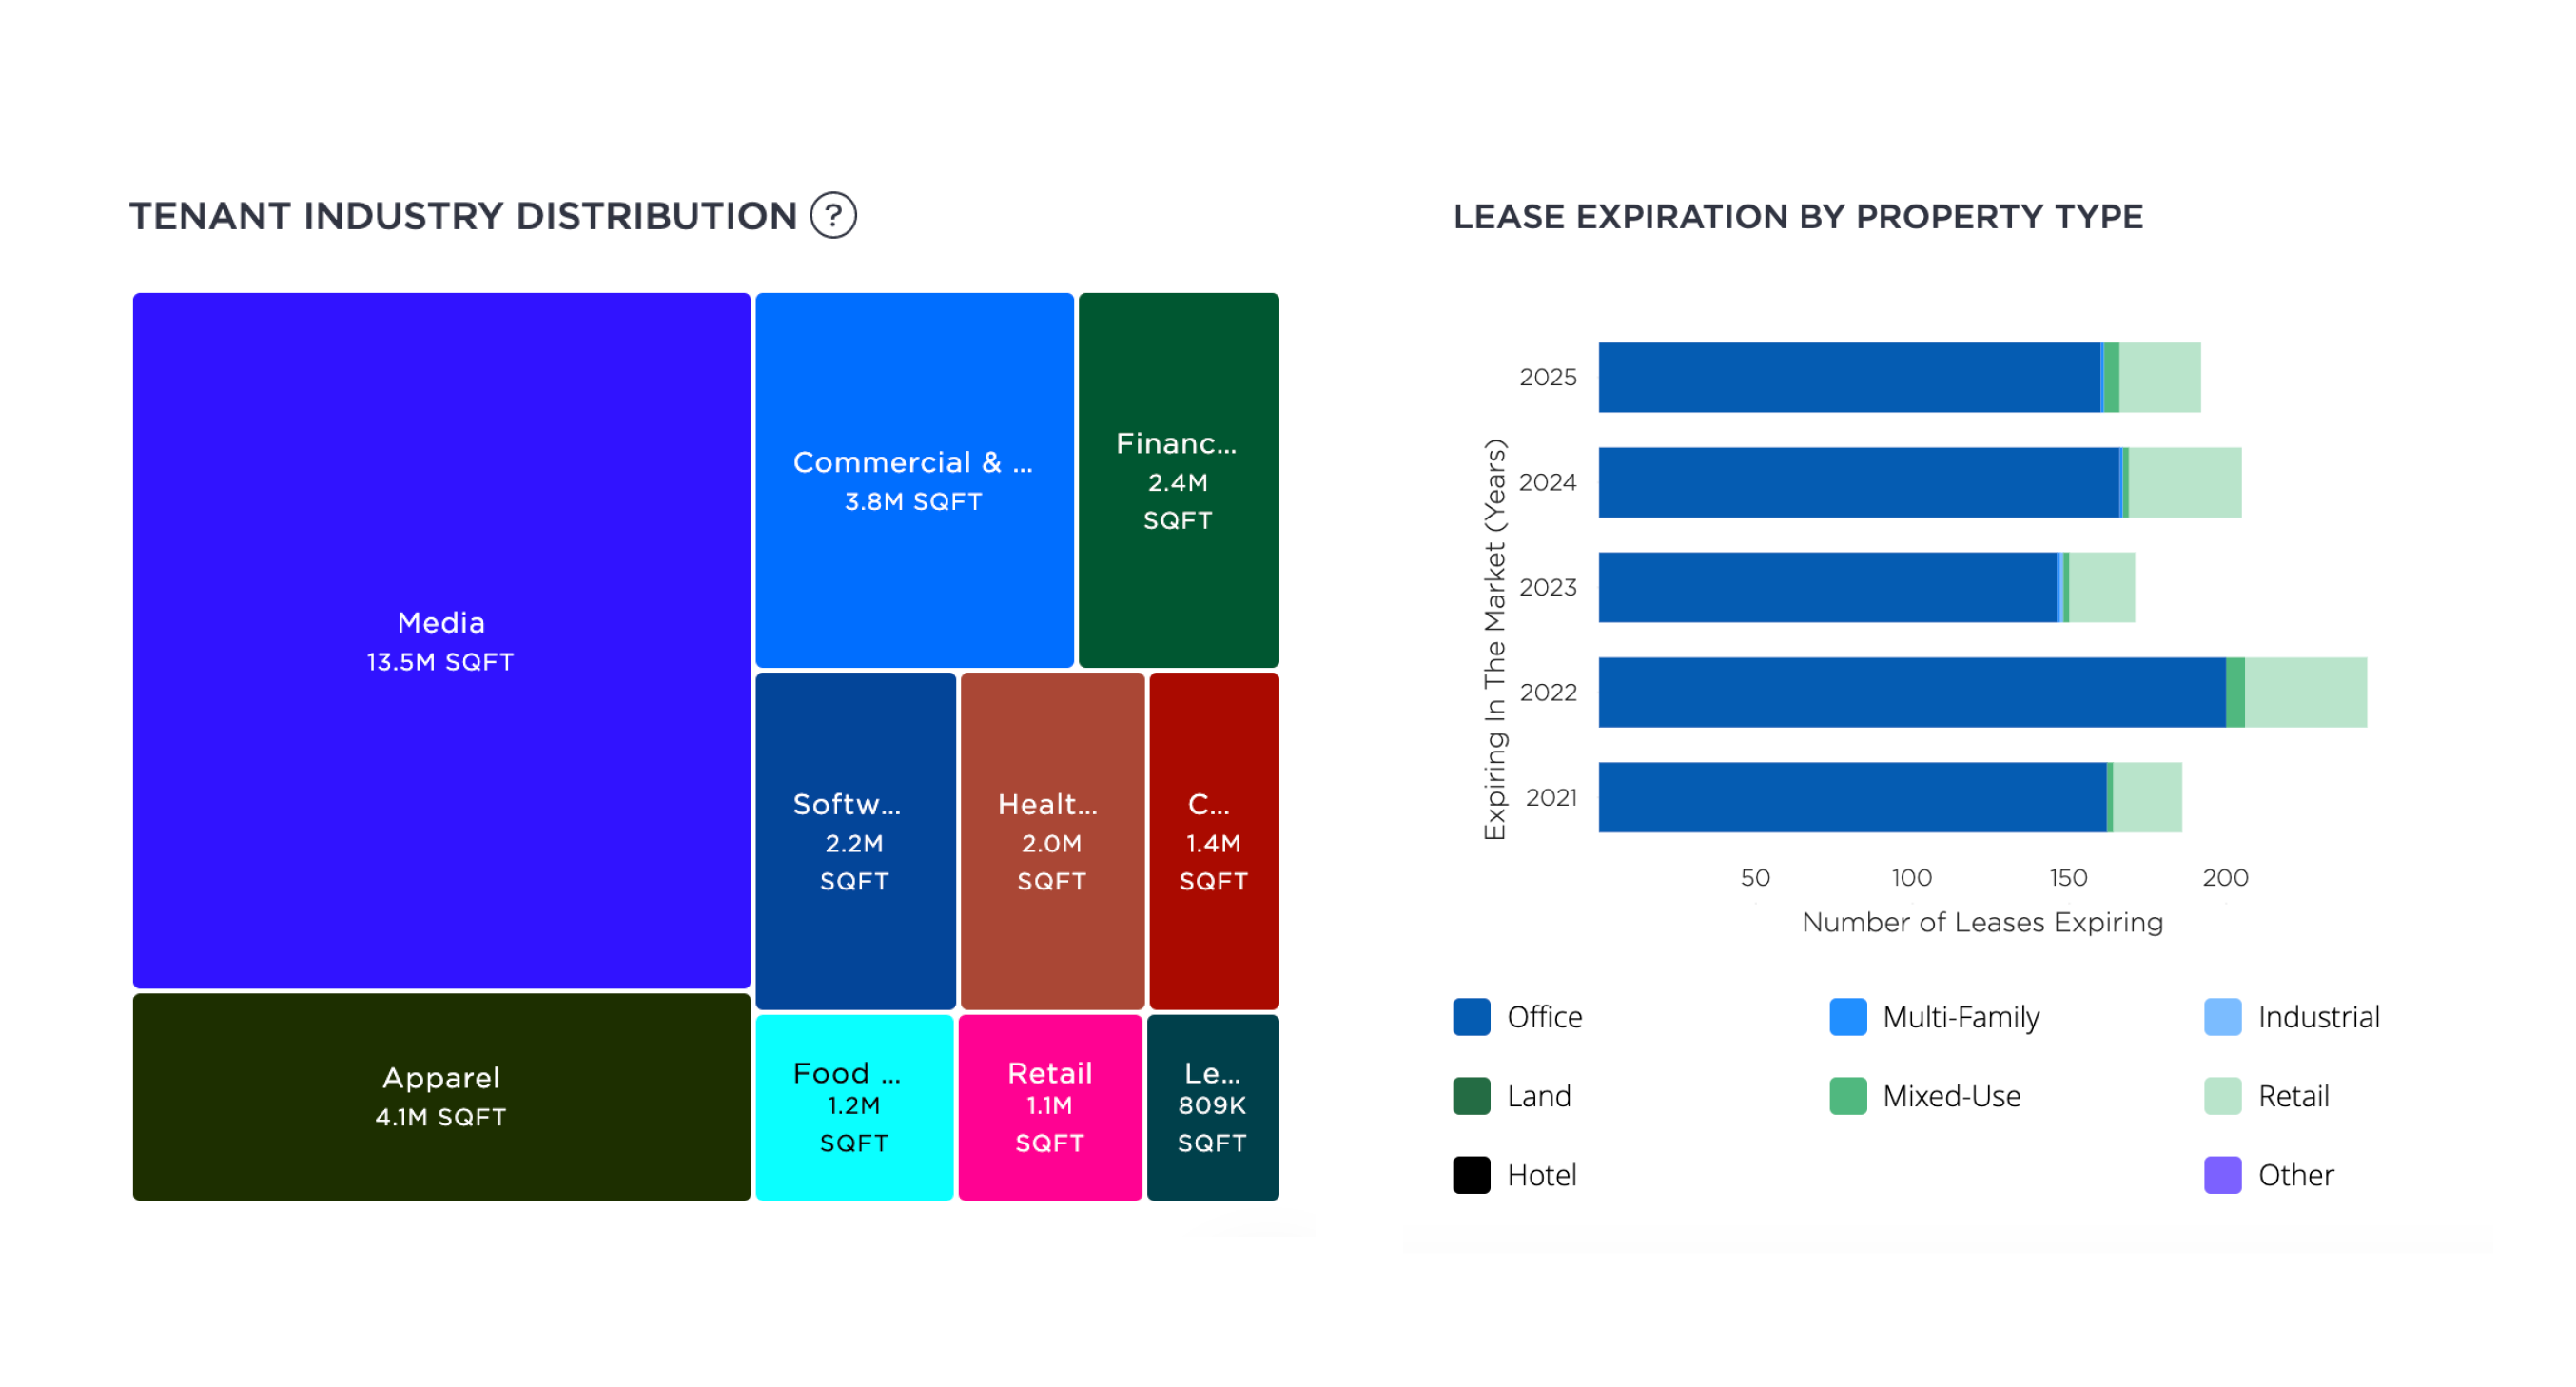
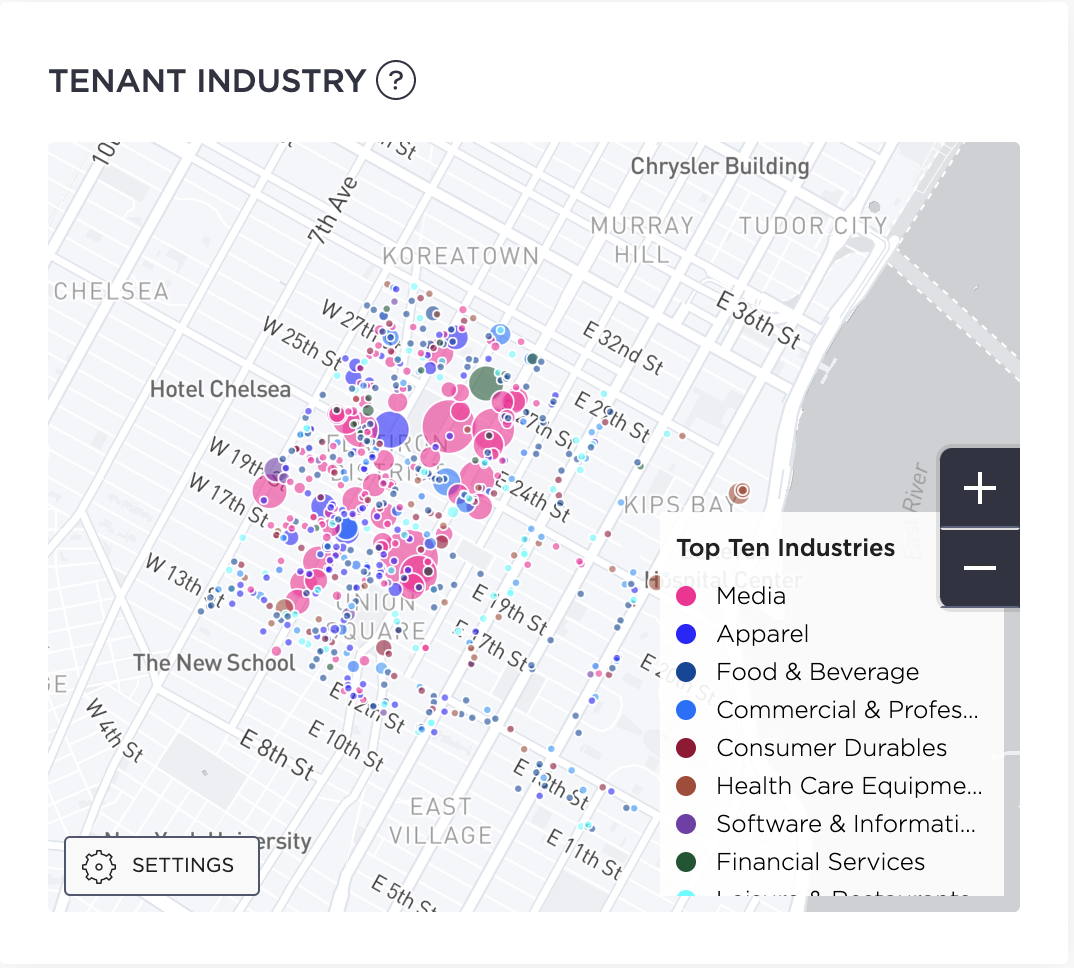
If your main focus is a specific industry such as media, you can use the Market Dashboard to identify opportunities and visually reveal regions with higher concentrations of tenants within that sector. In the image above, you can clearly see that media is the most prevalent tenant industry in the Gramercy / Union Square submarket.
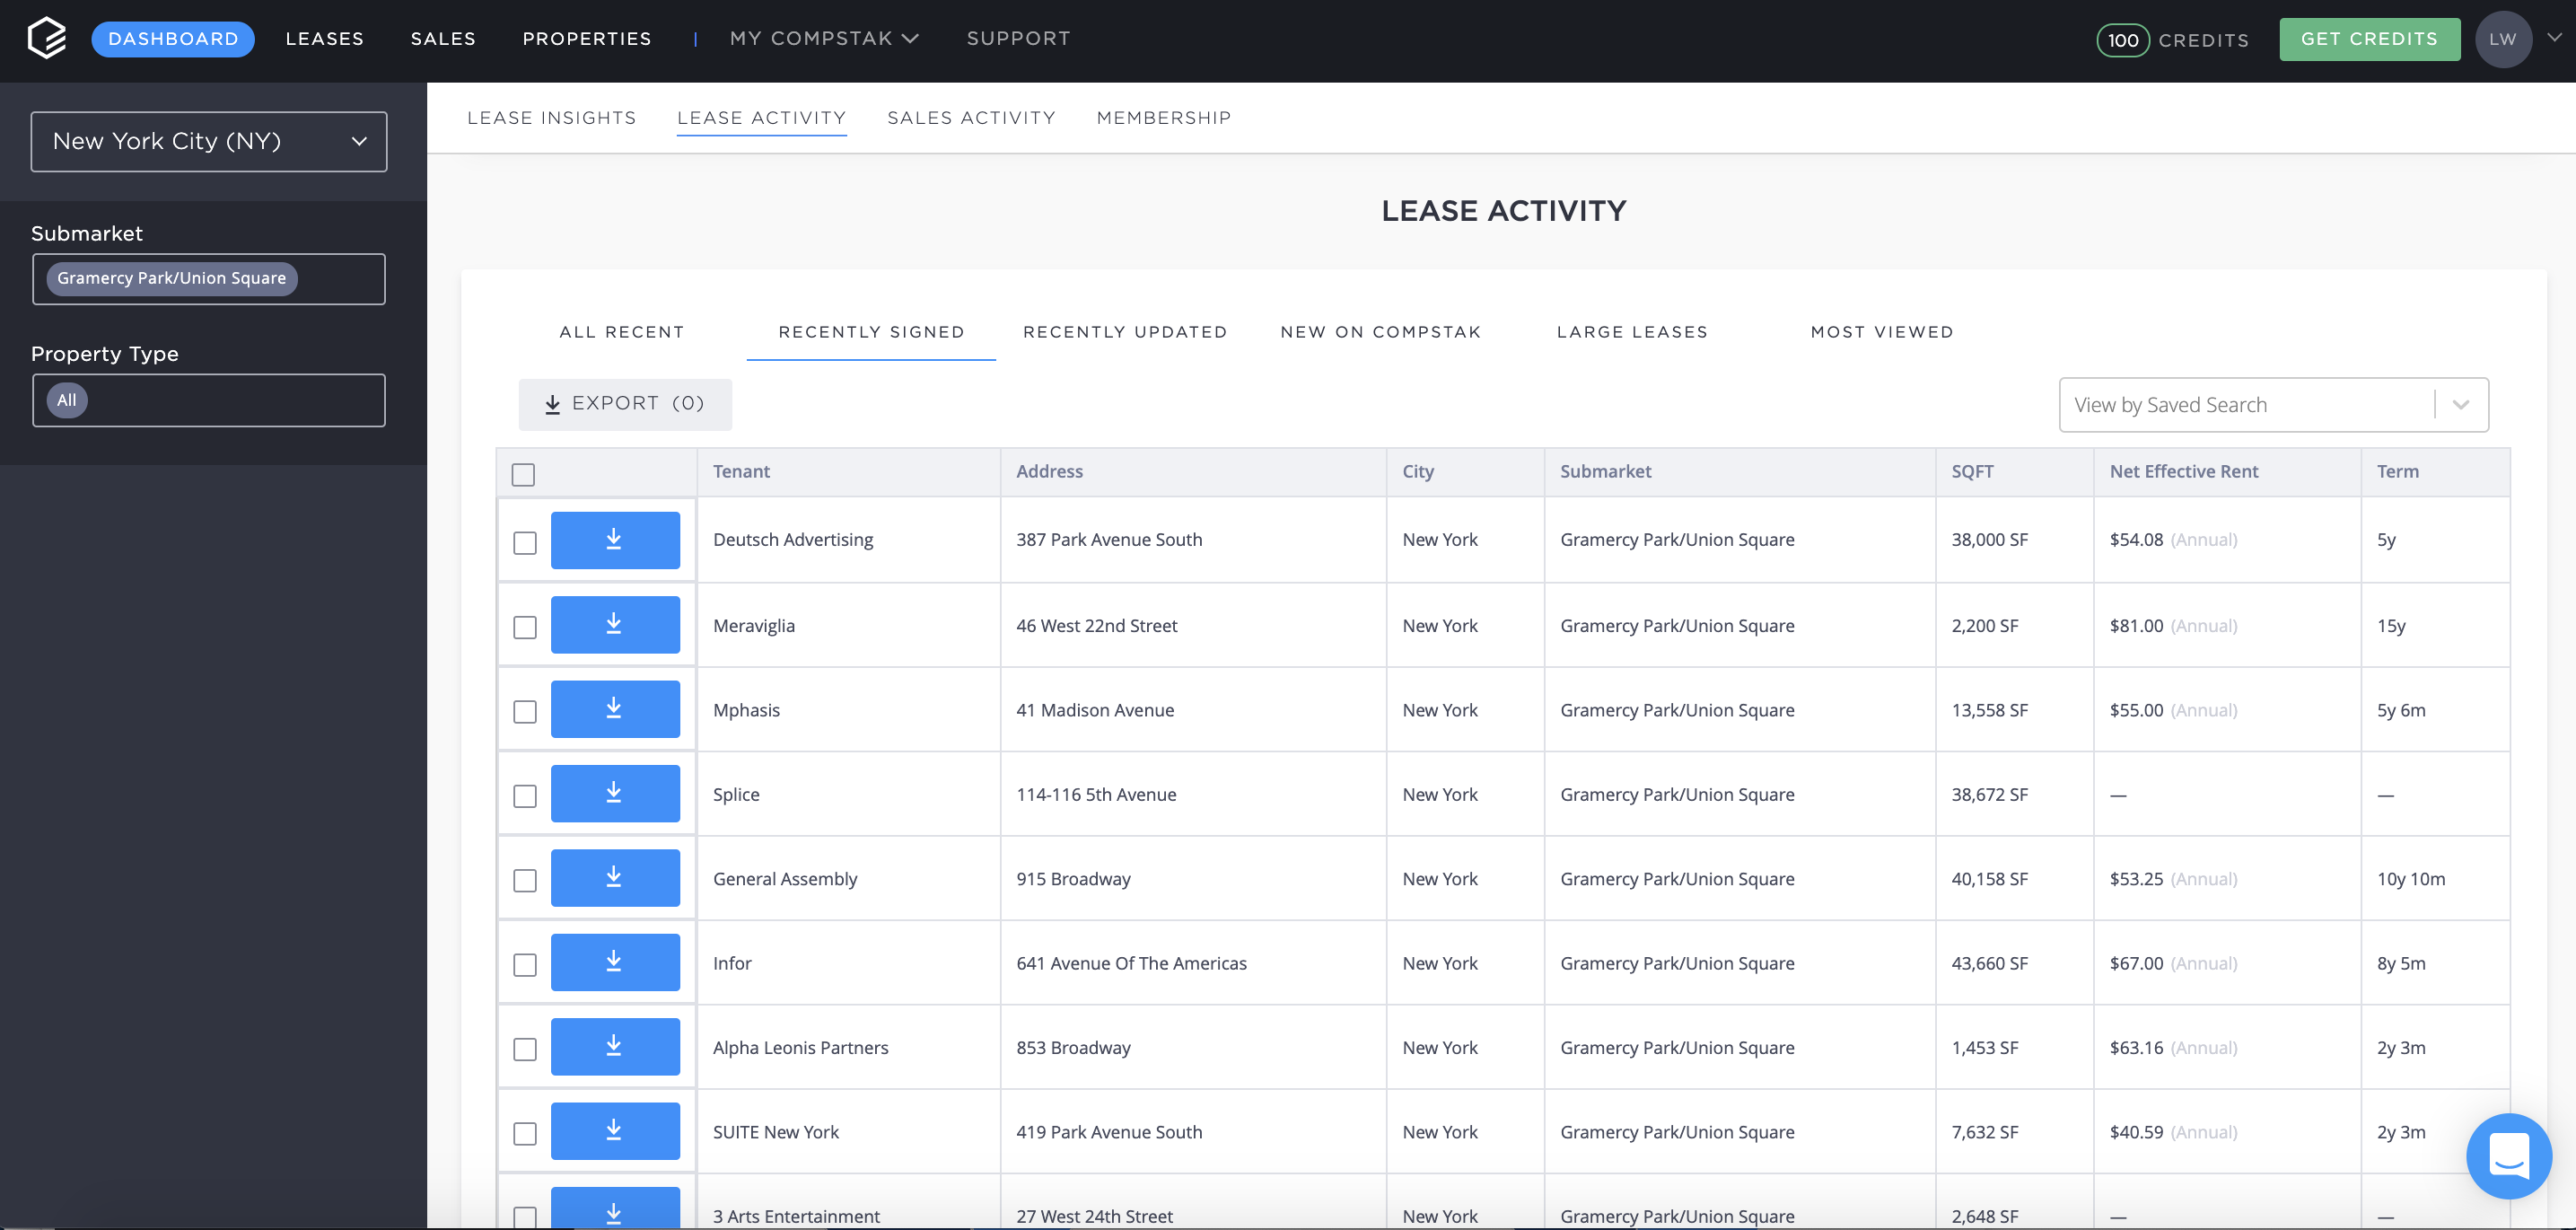
In order to stay competitive and best support your clients, it is important to stay in the know on the most recently signed leases in the market to get a better idea of lease structures, rent prices, and which tenants are signing. The Lease Activity monitor provides a quick way to see the 50 most recently signed leases on the CompStak platform in the market, submarket, or property type of your choosing.
These are just a few of the ways that CompStak can be utilized to closely examine the current status of a market and find potential opportunities that are not readily apparent. And you get free access to this set of analytics and research tools.
Having all this data at your fingertips along with a comprehensive research tool will provide you with the granularity and insights in order to make more informed decisions and give you a leg up on the competition.
Related Posts
Guide to the Best Commercial Real Estate Listings Sites

Guide to the Best Commercial Real Estate Listings Sites

Impacts of Rising Interest Rates and Inflation on CRE
